30-Year Treasury Key Levels This Week — Support, Resistance & Confluence Zones
30-Year Treasury key levels breakdown: support zones, resistance zones, confluence and price structure.

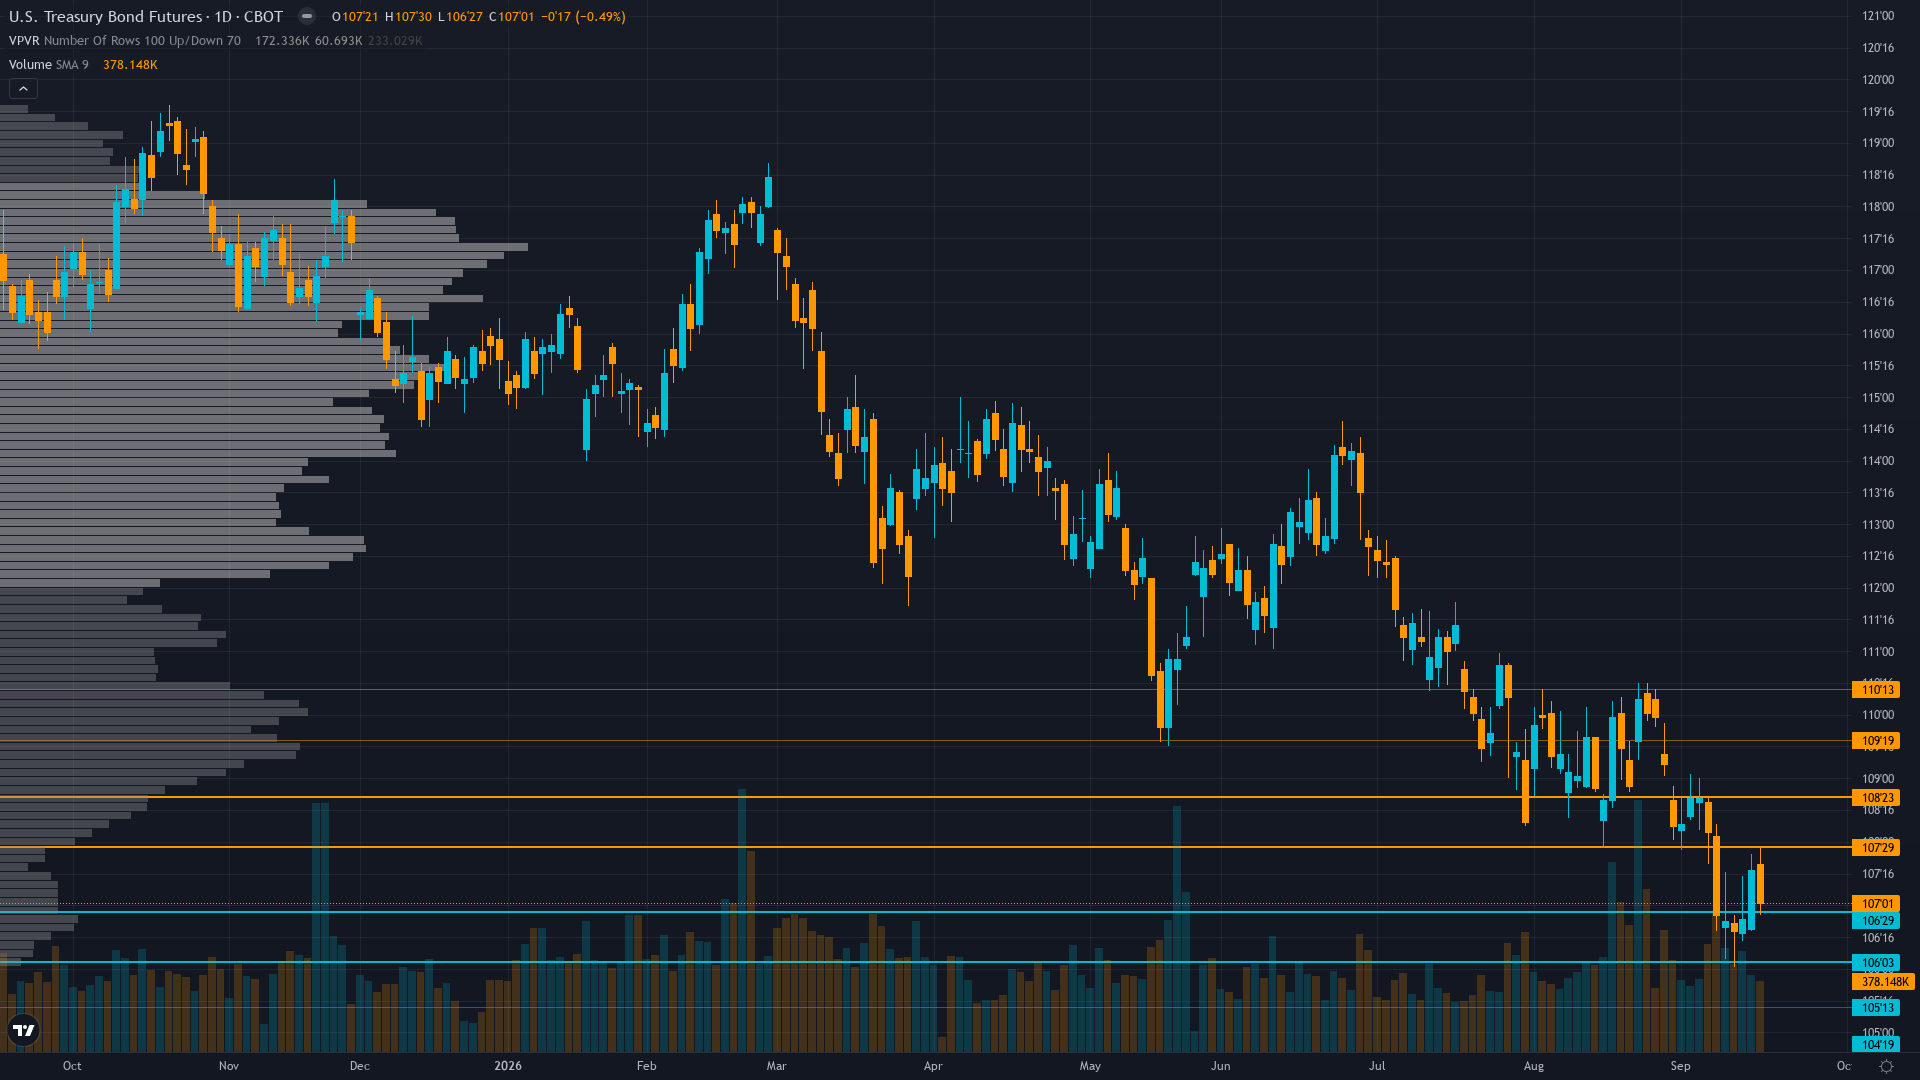
Current Price Structure
30-year Treasury sits at 107.5625 after slipping 0.17% — a shallow pullback rather than a decisive move. Treasury bond futures is in a breaking down market state, requiring careful assessment of current conditions.
Daily downtrend intact and accelerating: price at 107.5625 at the 3.1st percentile of 52-week range (107.1875-119.2813) after breaking below prior support at 108.31; price well below 50-day and 200-day moving averages with deeply bearish MA alignment; RSI likely oversold below 30 with momentum confirmed by -2.19% monthly decline; price just 0.38 points above the absolute 52-week low of 107.1875 — a break below would target 106.00 major psychological support; realised vol at 7.2% (20-day) within normal range for ZB but elevated relative to its 0.59% avg weekly move
With trend strength at 7/10, there's a clear directional tilt but room for the move to develop further.
Support Zone Context
Below the current level, ZB futures has structural support where demand has historically stepped in. The reliability of these zones depends on the volume profile and the number of prior interactions.
In the current trending down environment, support zones carry higher probability of holding but slower reaction times.
Ceilings & Supply Zones
Above current price, Treasury bond futures faces resistance zones where selling pressure has historically intensified. These levels represent previous supply zones, profit-taking areas, or structural barriers that price needs to overcome for continuation.
How firmly these zones hold depends on the confluence of volume, prior reactions, and the current market regime.
Where Disciplines Converge
For ZB futures, the levels that matter most are those confirmed by independent analytical approaches. When six different disciplines identify the same zone, the signal-to-noise ratio improves dramatically.
Volatility settling into low-normal regime after the Sep 16 FOMC resolution; daily ranges compressing from 1.0-1.5 handles during the pre-FOMC selloff toward 0.5-0.7 handles as the market consolidates; ZB at 107.56 just 0.38 points above the 52-week low at 107.19 creates a tactical tightrope where stop-loss cascades below 107.19 could expand vol to 1.0-1.5 handles on breakdown; given BOND category and low vol regime, effective noise floor rises to ~0.65%
How Macro Agent Desk Identifies Key Levels
Macro Agent Desk identifies key levels through a six-agent process. Each analytical discipline contributes independently — technical for structure, institutional for smart money interest, options for hedging activity, fundamentals for fair value context, sentiment for crowd positioning, and economics for catalyst timing.
What this means in practice: every key level in the full weekly report has been stress-tested across multiple independent analytical frameworks before it reaches the page.
Our paid reports include specific support and resistance levels identified by six specialist agents — technical structure, institutional positioning, options flow, fundamentals, sentiment, and economic analysis. Not just lines on a chart, but zones validated by multi-discipline confluence.
Start Free — Get the Market of the WeekFree weekly report · No credit card · Upgrade anytime



