30-Year Treasury Forecast This Week — Outlook, Drivers & Key Levels
This week's 30-Year Treasury outlook: key drivers, volatility context, risk-opportunity assessment and the week ahead.

Current Market Picture
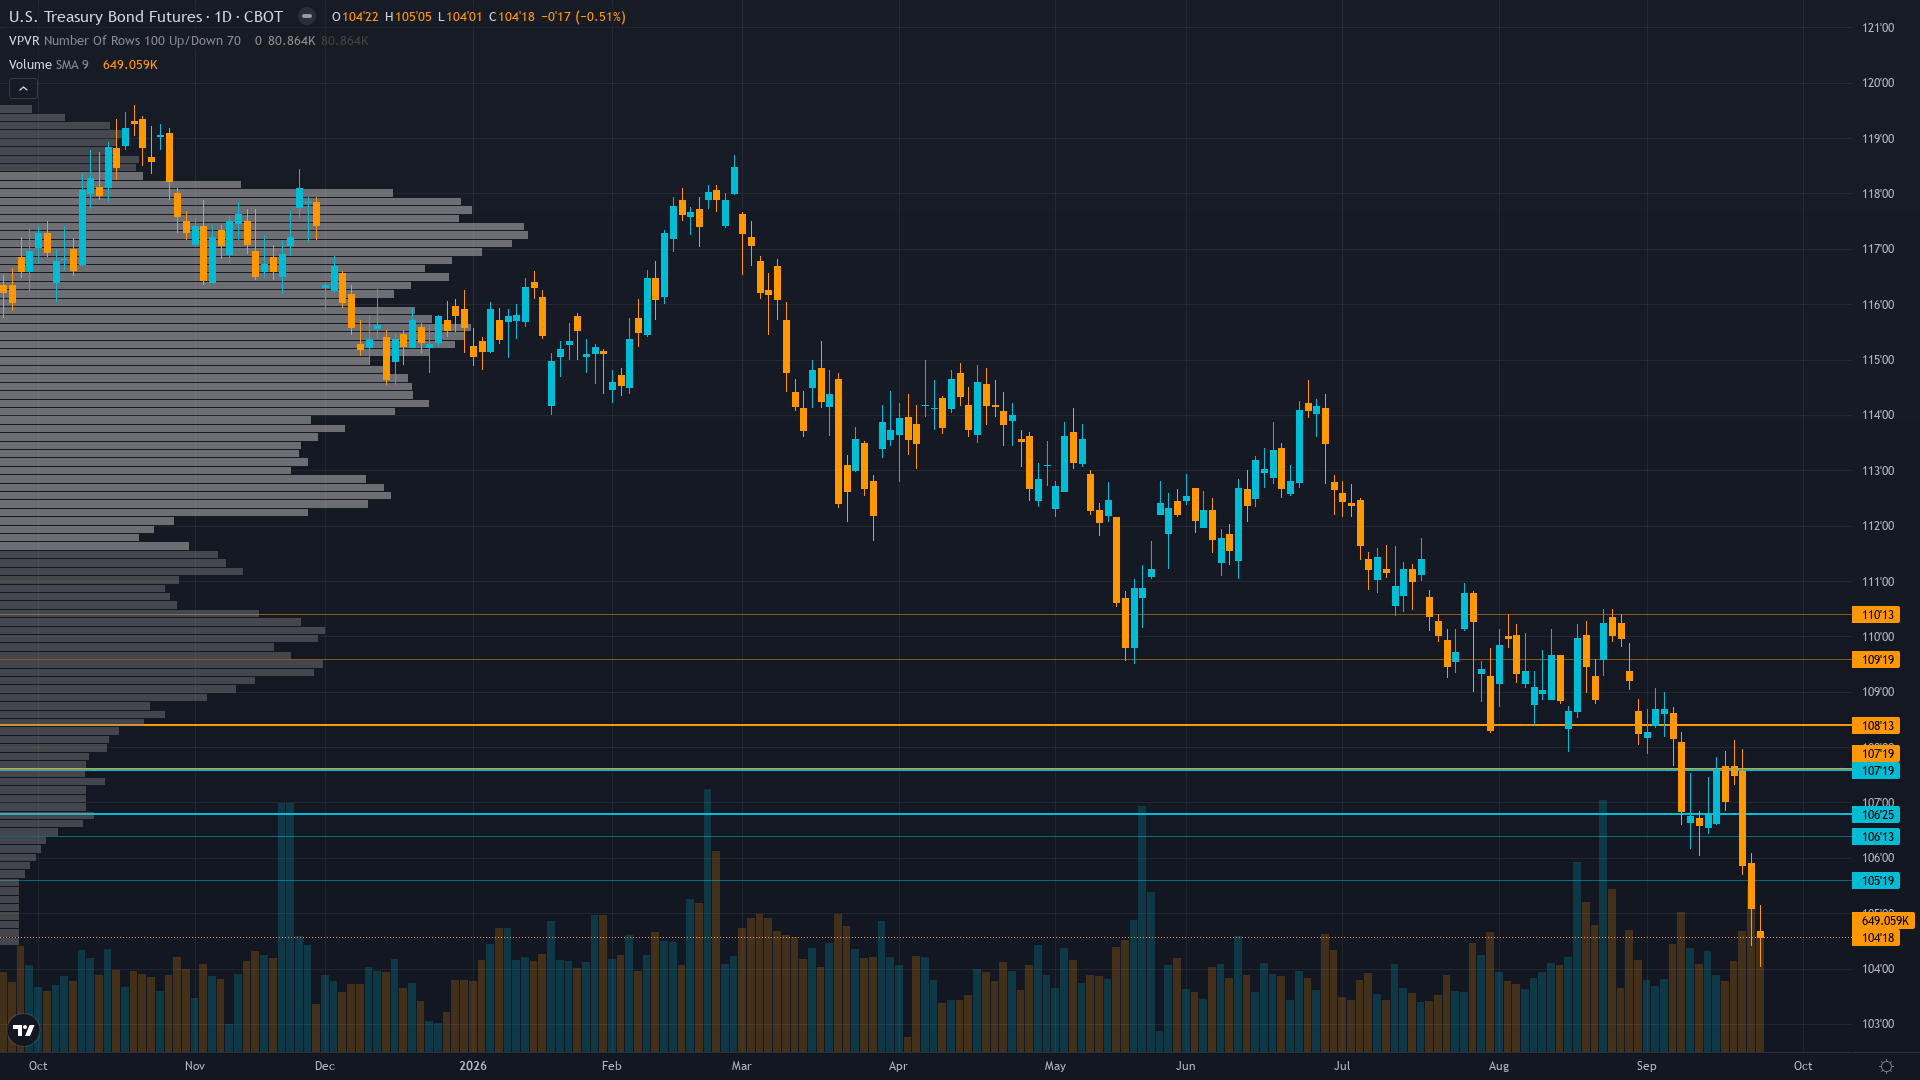
Trading at 104.6875 with a 0.51% dip, 30-year Treasury is giving back ground gradually. Treasury bond futures is in a breaking down market state, requiring careful assessment of current conditions.
Market pricing structural bearish duration environment with 30Y at 5.49-5.50% (2004 highs); ZB crashing to 52-week low after -2.79% weekly collapse accelerated by hawkish Fed repricing pricing 65-71% probability of October 25bp hike; MOVE Index spiking 30% to 104 confirming bond market panic; Bessent buyback ongoing but insufficient to absorb supply deluge from $1.97T fiscal deficit
Key Drivers This Week
Primary driver: Accelerating bond selloff pushing 30-year yield to 5.49-5.50% (highest since 2004) driven by hawkish Fed repricing after Sep 16 25bp hike, with Polymarket and CME FedWatch now pricing 65-71% probability of another 25bp hike at the Oct 28 FOMC meeting — the structural tightening cycle that began with Warsh's June 17 removal of easing bias has escalated into a full repricing of the terminal rate path through 2027
Secondary factor: MOVE Index surged ~29.69% this week to ~104 (Bloomberg Sep 25) — the biggest weekly jump since Liberation Day April 2026 tariffs — as bond market volatility explodes to extreme levels not seen since March, confirming capitulation-grade price action in the 30-year sector with realised vol at 8.4% (20-day) well above ZB's 0.59% average weekly move; the divergence between soaring MOVE and contained VIX at 16.34 signals bond-specific stress not yet transmitted to equities
Additional influence: CFTC COT Sep 22 shows non-commercial net short at -155,805 contracts (14.6th percentile of 3-year range), improving by +47,352 contracts from the prior week — the first material short covering in weeks as the bottom fell out and shorts took profits into the -2.79% weekly collapse, but positioning remains in contrarian territory with significant squeeze potential if any dovish catalyst emerges from this week's Fed speech cadence (Bowman, Barkin, Goolsbee, Musalem, Williams, Waller on Sep 28-29)
Economic backdrop: Fed hiked 25bps to 3.75-4.00% on Sep 16 (first hike since 2023) with dot plot projecting low 4% through 2027; Polymarket now prices 65% probability of another 25bp hike at Oct 28 FOMC; CPI Aug at 2.34% stable but sticky; unemployment 4.1%; JOLTs Job Openings (Aug) due Sep 29 est 7.23M vs 7.271M prior — data that could shift rate expectations; macro regime is DIVERGENT — equities risk-on (VIX 16.34) while bonds price structural fiscal deterioration with 30Y at 2004 highs
Fundamental assessment: 30Y yield at 5.49-5.50% (highest since 2004) with FY2026 fiscal deficit tracking $1.97T through August and Treasury planning $739B Q3 borrowing; Bessent $4B/op buyback provides partial offset but insufficient to absorb supply at punishing yield levels; term premium compressed versus historical norms despite fiscal stress; Sept 15 20-year auction showed mixed demand (2.57 bid-to-cover); foreign demand declining per TIC data
Price Structure
Daily downtrend accelerating into capitulation: price at 104.6875 at the absolute 0th percentile of 52-week range (104.5625-119.2813) after breaking below 106.00 psychological support; price massively below 50-day and 200-day moving averages; RSI deeply oversold; 20-day realised vol at 8.4% elevated relative to ZB's 0.59% avg weekly move; declining open interest at 1.89M in the selloff suggests liquidation not fresh accumulation
With trend strength at 9/10, the prevailing move carries significant force behind it.
Upside & Downside
Primary risk: Dovish JOLTs print below 7.0M or dovish Fed speeches (Goolsbee, Williams, Waller) emphasizing economic fragility and signaling the tightening cycle may be nearing its end — combined with extreme short covering underway (already -47,352 contracts this week), the MOVE spike to 104, and quarter-end pension rebalancing on Sep 30, this could trigger a violent squeeze rally above 106.00 toward 108.00 resistance as remaining crowded shorts rush to cover, representing 1.5-3.0% upside from current levels near the 52-week low (Probability: medium)
Primary opportunity: Continued breakdown below 104.00 psychological support on hawkish JOLTs print confirming labor market tightness and hawkish Fed commentary reinforcing the Oct hike probability of 65%, with the 30Y yield targeting 5.60-5.75% as structural fiscal supply ($1.97T deficit) and declining foreign demand overwhelm the Bessent buyback program, driving ZB toward 102.00 major multi-year support representing 2.6% additional downside from current levels (Timeframe: Next 1-2 weeks through Sep 28-29 Fed speech cadence and Sep 29 JOLTs data, with the Sep 30 quarter-end rebalancing as a tactical event; the Oct 28 FOMC is the next major binary catalyst that will either validate or reverse the current tightening cycle trajectory)
This week's edge: The market may be overpricing the hawkish repricing trajectory at the point of maximum bearish momentum. Three factors are being underweighted: (1) the MOVE Index spike to 104 has historically preceded short-term reversals in Treasury markets as volatility exhaustion sets in, (2) the COMEX COT data shows aggressive short covering of -47,352 contracts already underway this past week, suggesting the smart money is reducing bearish exposure into the rout, and (3) the Bessent buyback program at $4B/op remains an active official-sector bid that provides a structural floor below which the Treasury itself will absorb duration. The Sep 30 quarter-end pension rebalancing is expected to add significant duration demand after equities' outperformance relative to bonds this quarter. However, these are tactical squeeze considerations within a structural downtrend — the dominant narrative of fiscal supply, hawkish Fed, and sticky inflation remains intact. The desk maintains BEARISH conviction 7/10, but acknowledges that the pace of decline (-4.7% in 4 weeks) creates asymmetric near-term squeeze risk that limits upside conviction toward 8+. When the measured calibration shows this class's conviction at 7 has performed at 73% accuracy historically, and the Section 2A note explicitly states 'this class's conviction has UNDERSTATED the strength of its evidence,' the appropriate response is to issue the conviction the evidence supports — which is 7, not capped artificially lower.
Volatility Context
At the 88th percentile of its 90-day range, T-bond futures volatility is running hot, creating both opportunity and risk for directional traders. Realised vol is trending higher across the curve, which tends to accompany transitional periods where the market is repricing risk.
Volatility is in a high and rapidly expanding regime creating conditions for violent breakout moves in either direction; daily ranges have expanded from 0.5-0.7 handles during consolidation to 1.0-1.5 handles in the current breakdown; stop-loss placement is extremely challenging — standard ZB stop widths of 0.5-0.8 handles risk being triggered by noise within the expanded daily ranges; the divergence between MOVE (~104) and VIX (~16.34) highlights that this is a bond-specific volatility event, not a broad macro risk-off move, which creates the potential for a non-correlated squeeze if the catalyst shifts
Week Ahead Outlook
The next major catalyst is JOLTs Job Openings (Aug) at 14:00 UTC — estimate 7.23M vs prior 7.271M; preceded by S&P/Case-Shiller Home Price YoY (Jul) at 13:00 UTC est 2.2% vs 2.1%; CB Consumer Confidence (Sep) at 14:00 UTC est 90 vs 89.4; followed by 5 Fed speeches (Bowman, Goolsbee, Musalem, Williams, Waller) creating concentrated catalyst window on Tuesday 29 September — a high-impact event that could materially shift the directional picture.
For long bond, the balance between existing momentum and scheduled risk events sets the stage for the week ahead.
This analysis covers one dimension. Our full weekly report combines six specialist agents into a single actionable briefing with directional bias, key levels, and risk-opportunity matrix.
Start Free — Get the Market of the WeekFree weekly report · No credit card · Upgrade anytime


