30-Year Treasury Forecast This Week — Outlook, Drivers & Key Levels
This week's 30-Year Treasury outlook: key drivers, volatility context, risk-opportunity assessment and the week ahead.

Market Overview
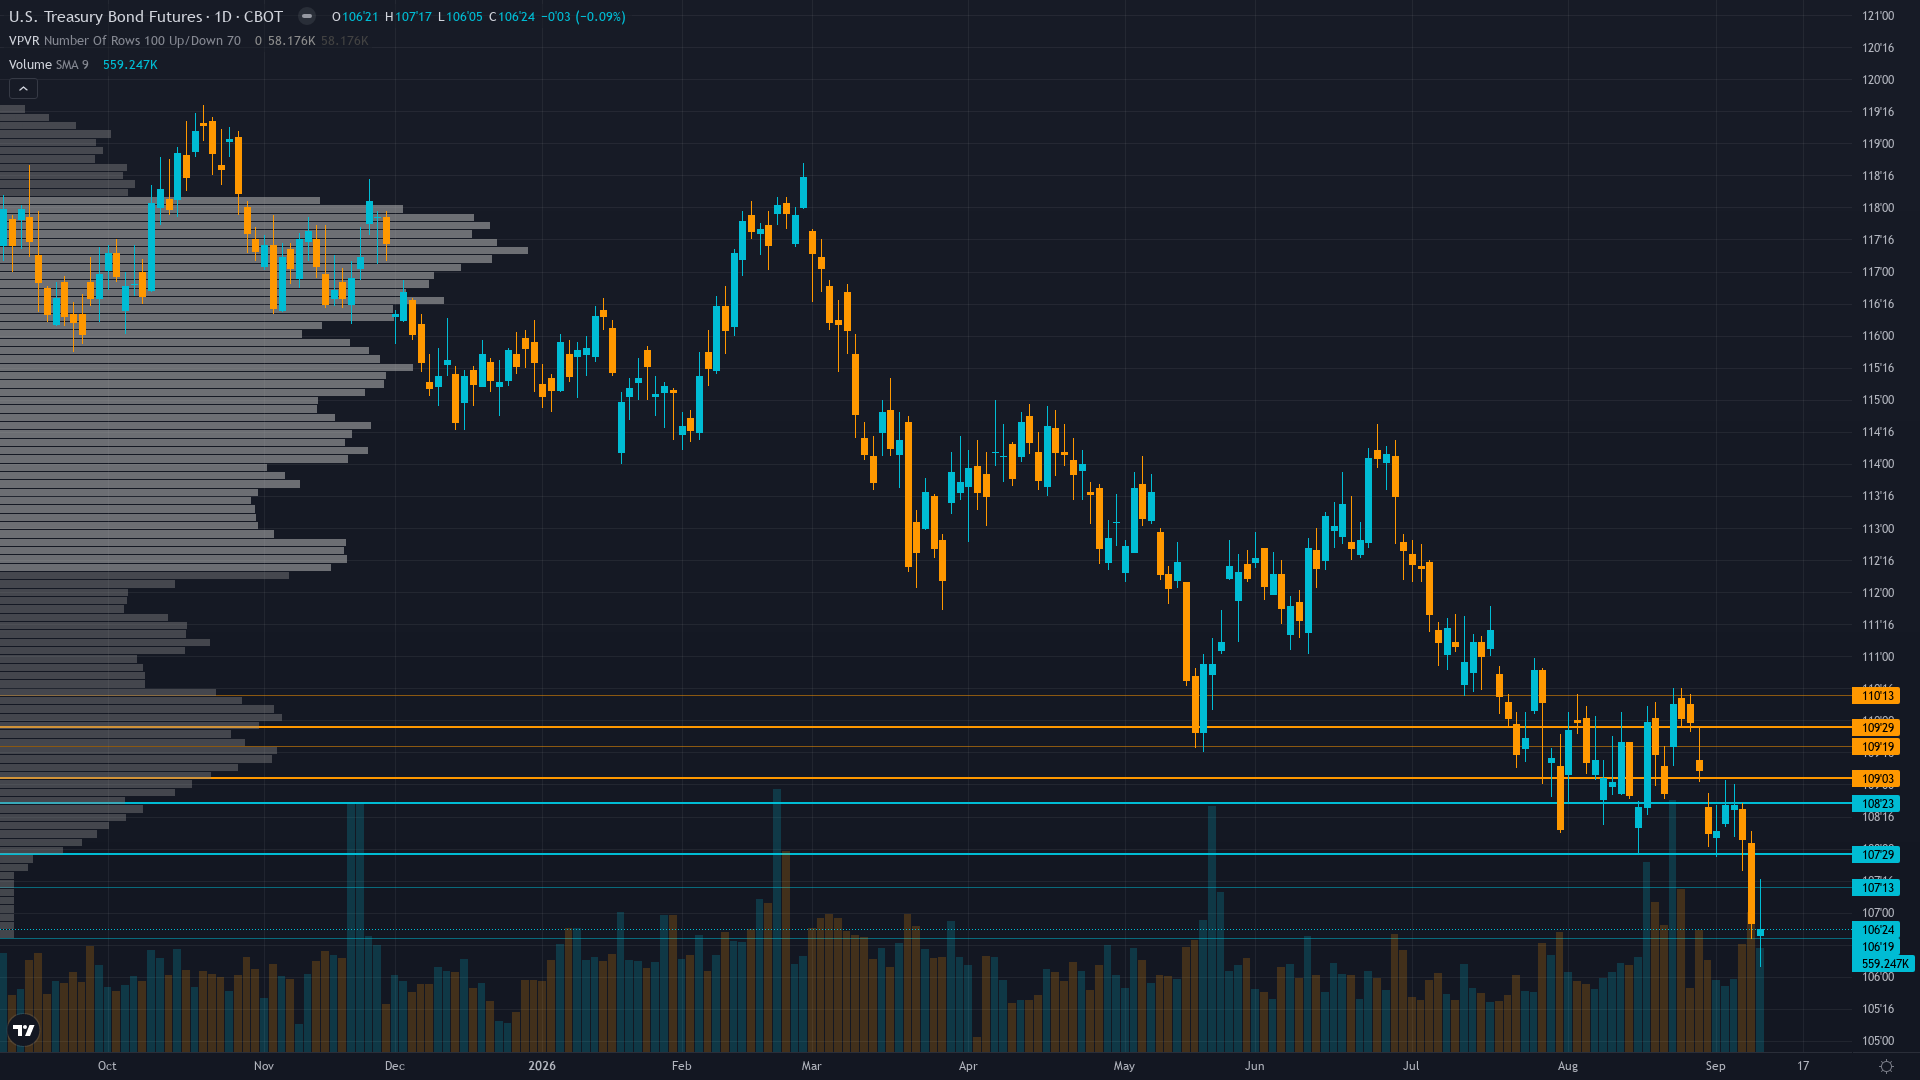
30-year Treasury holds at 107.2813, off 0.17% in a modest retracement from recent levels. Treasury bond futures is in a breaking down market state, requiring careful assessment of current conditions.
Market pricing structural bearish duration environment with 30Y at 5.36% (19-year highs); ZB breaking down below 108.31 52-week low toward 105-107 zone; FOMC Sep 16 dot plot expected to confirm hawkish tilt; J.P. Morgan and Capital Economics leaning toward rate hike; Bessent buyback acknowledged but deemed insufficient at current yield levels
This Week's Catalysts & Drivers
Primary driver: 30-year yield at 5.36% (19-year highs per Trading Economics Sep 11) with ZB at the absolute 52-week low of 107.2813 after breaking below prior support at 108.31; structural bearish supply dynamics ($1.97T FY2026 deficit projections per Bloomberg Sep 11, declining foreign holdings to $9.299T in June 2026 per Trading Economics) now driving yield acceleration above the 5.30% resistance level with the 52-week low now acting as resistance rather than support
Secondary factor: FOMC Economic Projections on Sep 16 (3 days forward) is the binary catalyst that resolves the tension between the established structural bearish trend and extreme COT short positioning (-200,517 contracts, 3.8th percentile per CFTC COT Sep 8) — the updated dot plot and SEP will either validate the existing hawkish repricing (yields surge, ZB breaks major support at 105) or trigger a violent squeeze from the most crowded short positioning in 3 years; JP Morgan and Capital Economics leaning toward a 25bp hike (OG.com Sep 4), Polymarket previously showed 51% September hike probability
Additional influence: CFTC COT Sep 8 data shows non-commercial net short at -200,517 contracts (-11.1% of OI, 3.8th percentile of 3-year range, near the 3-year minimum of -239,646) with minimal weekly change of -1,016 contracts — extreme bearish positioning that has persisted near the 3-year minimum for 5+ weeks without material short covering; combined with hedge fund basis trade exposure at $830B (Federal Reserve research), this creates asymmetric squeeze potential should the FOMC deliver any dovish surprise in the dot plot or forward guidance
Economic backdrop: Fed funds at 3.63%; CPI Aug 2026 at 334.131 (inflation 2.36% stable but above 2% target); unemployment 4.1%; FOMC Economic Projections Sep 16 with updated dot plot (market pricing tilt toward hike per JP Morgan/Capital Economics); Retail Sales (Aug) Sep 16 estimate 0.9% MoM vs -0.6% prior — data cluster coincident with FOMC creates concentrated risk window; macro regime is DIVERGENT — equities risk-on (VIX 16.34, HY spreads tight at 2.65%) while long bonds price structural fiscal deterioration with 30Y at 19-year highs
Fundamental assessment: 30Y yield at 5.36% (19-year high) with FY2026 deficit tracking $1.97T (Bloomberg Sep 11); foreign Treasury holdings declined to $9.299T in June 2026 (Trading Economics); September 9 10-year auction showed 2.71 bid-to-cover with 79.2% indirect participation — mixed demand at higher yields; Bessent's $4B/op buyback program (began Sep 9) providing partial official-sector offset but insufficient to reverse structural supply-demand imbalance; term premium elevated keeping structural bearish pressure intact
Technical Picture
Daily downtrend intact and accelerating: price at 107.2813 at the absolute 52-week low after a -1.77% weekly decline, breaking below the prior 108.31 support level now acting as resistance; price well below all key moving averages with bearish MA alignment; RSI likely deeply oversold below 25-30; 20-day realised vol at 8.4% elevated relative to ZB's 0.59% avg weekly move; declining open interest at 1.80M in the selloff suggests liquidation rather than fresh accumulation, which is bearish for stabilization
At 7/10, trend strength indicates a solid directional lean without being overextended.
Bull & Bear Case
Primary risk: Dovish FOMC surprise: if the SEP shows lower terminal rate projections or Warsh signals openness to cutting in 2026 given the 2.36% inflation rate and 4.1% unemployment, the extreme COT short positioning (-200,517 contracts, 3.8th percentile) triggers a violent squeeze rally above 108.31 toward 110.00-112.00 representing 1.5-3.5% upside from current levels, as crowded speculative shorts rush to cover into the Bessent buyback program providing official-sector demand (Probability: medium)
Primary opportunity: Hawkish FOMC validation: if the dot plot confirms the hawkish tilt (potentially with additional hike proponents, building on the 3 dissenting votes from the July 29 meeting), ZB extends breakdown below 106.50 toward 105.00 major support representing 2.1% additional downside from current 107.28 levels, as the structural supply thesis (record deficit, declining foreign demand, elevated term premium) validates the 30Y yield trajectory toward 5.50-5.75%; Bessent buyback program deemed insufficient to absorb supply deluge at 19-year high yields (Timeframe: Next 3-5 days through FOMC Sep 16 decision and immediate post-decision repricing, with follow-through over subsequent 1-2 weeks as markets digest the updated SEP dot plot implications for the terminal rate path through 2027)
This week's edge: The market may be underappreciating the squeeze asymmetry embedded in the current setup: COT non-commercial net short at -200,517 contracts (3.8th percentile) near the 3-year minimum, combined with the Bessent buyback program ($4B/op starting Sep 9) providing official-sector demand at the long end, and the MOVE Index spiking to 82.21 (up 6.98% in 24h) signaling options markets are pricing elevated tail risk. If the FOMC Sep 16 dot plot delivers any dovish signal — lower terminal rate, acknowledgment of 2.36% inflation progress, or hints of 2027 cuts — the extreme bearish speculative crowding could trigger a violent short squeeze exceeding the magnitude that standard yield-fair-value models would suggest. Conversely, if the FOMC validates the hawkish trajectory, the structural supply thesis accelerates yields toward 5.50-5.75% with the breakdown below 106.50 targeting 105.00 major support. The edge lies in recognizing that the bearish consensus is so deeply embedded (3.8th percentile positioning, 19-year yield highs, multiple hawkish FOMC signals) that the marginal surprise is asymmetric toward the upside if Warsh moderates, while the downside continuation requires no new hawkish information — merely unchanged guidance. This asymmetry favours restraint at current levels even while the structural trend supports the bearish direction.
Volatility Regime
Volatility for T-bond futures is at the 68th percentile over 90 days — a normal regime that allows for standard position sizing and conventional trade management. The volatility trend is up, with expansion across timeframes pointing to growing uncertainty in near-term price action.
Volatility expanding into normal-to-elevated regime creating favorable conditions for directional breakout; daily ranges expanding from 0.5-0.8 handles during consolidation toward 1.0-1.5 handles as MOVE spikes; ZB at 107.28 has broken below 108.31 support that now acts as resistance; stop widths should widen to 1.5-2.0 handles given binary FOMC catalyst 3 days forward; elevated vol means false breakouts are more likely but sustained moves are more meaningful when they confirm
What to Watch
The FOMC Economic Projections and dot plot release at 18:00 UTC, preceded by Retail Sales MoM (Aug) at 12:30 UTC est 0.9% vs -0.6% prior; NY Empire State Manufacturing (Sep 15) at 12:30 UTC est 15 vs 20.6 prior; FOMC decision with SEP and dot plot plus Chair Warsh press conference at 18:30 UTC — this is the most consequential FOMC since July 29 and the first with updated dot plot since June 17 on Wednesday 16 September stands as the week's primary risk event — high-impact and capable of overriding the existing technical and sentiment setup.
The interplay between breaking down market conditions and upcoming catalysts will define this week's trading landscape for ZB futures.
This analysis covers one dimension. Our full weekly report combines six specialist agents into a single actionable briefing with directional bias, key levels, and risk-opportunity matrix.
Start Free — Get the Market of the WeekFree weekly report · No credit card · Upgrade anytime



