30-Year Treasury Forecast This Week — Outlook, Drivers & Key Levels
This week's 30-Year Treasury outlook: key drivers, volatility context, risk-opportunity assessment and the week ahead.

Market Overview
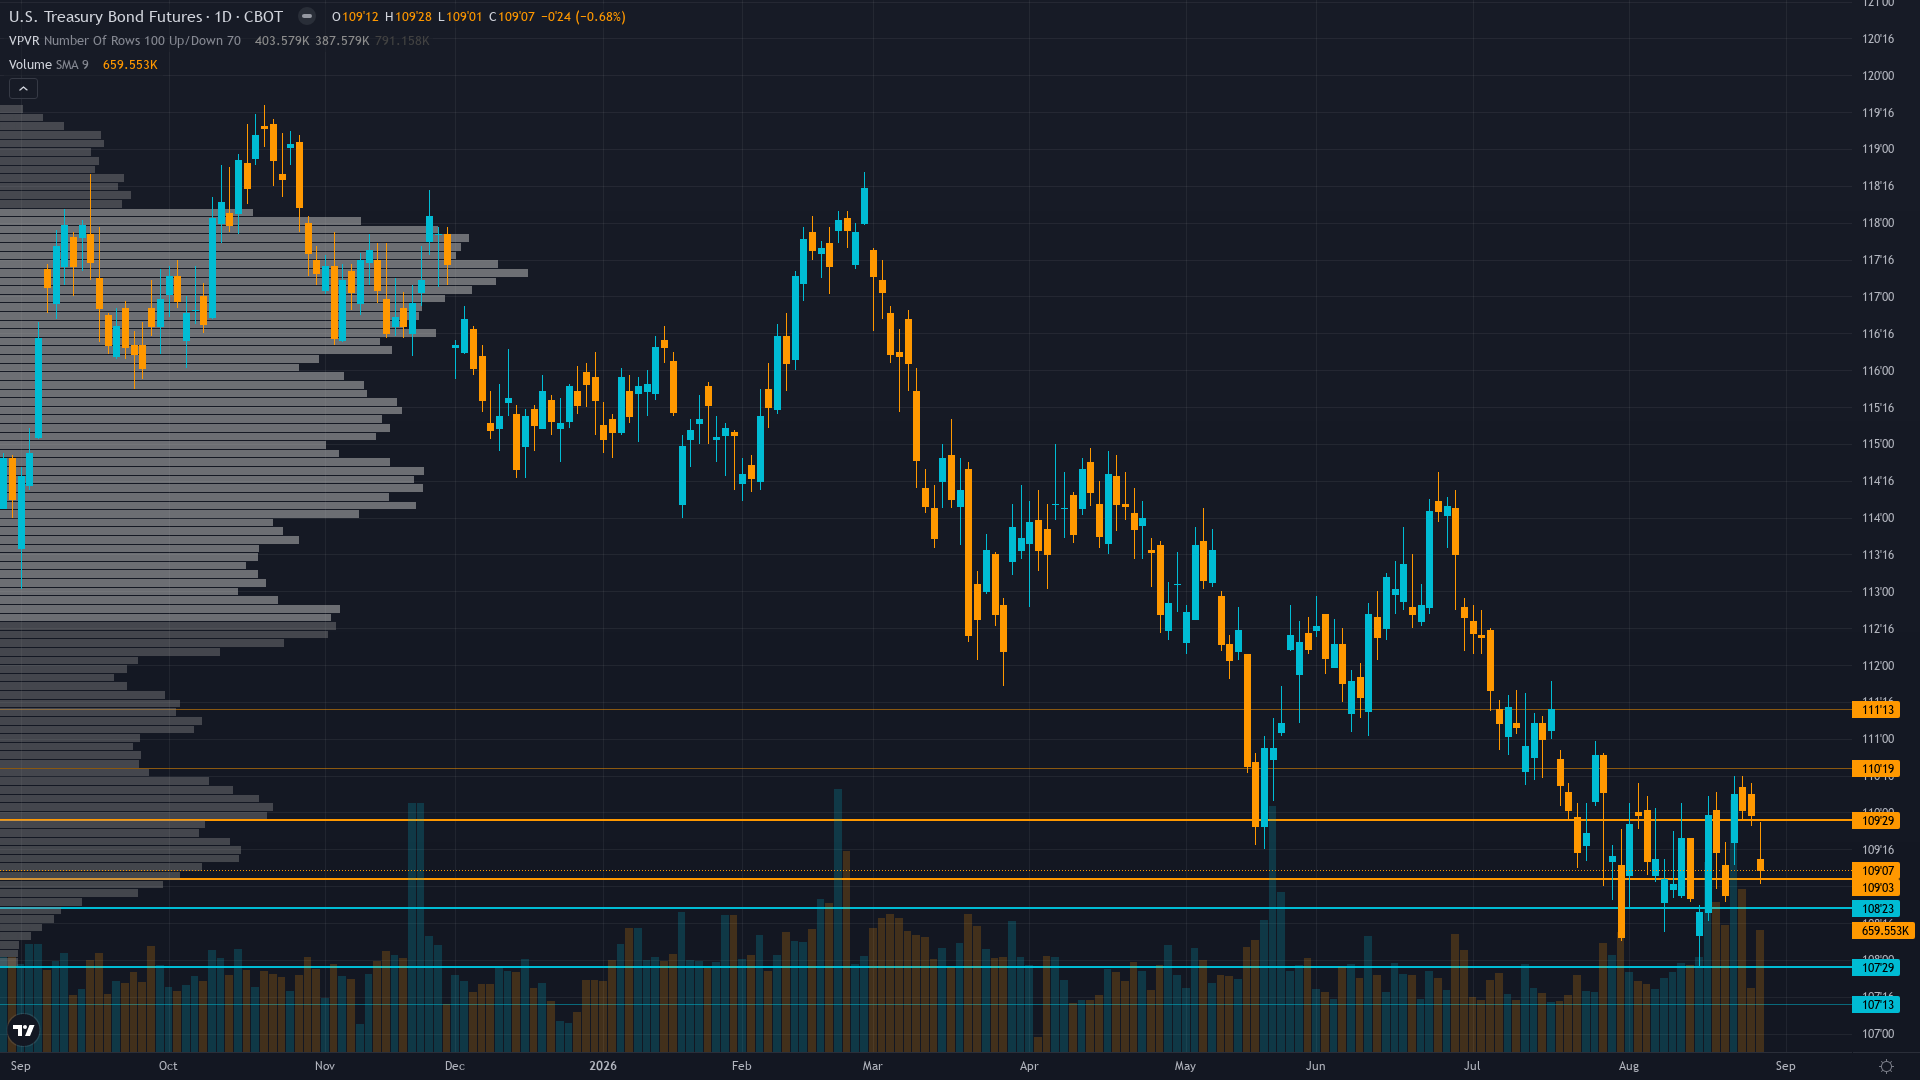
30-year Treasury holds at 109.6875, up a marginal 0.23% as the market grinds forward. Treasury bond futures is range-bound and tightening, with decreasing volatility signalling a directional resolution ahead.
Market pricing structural bearish duration environment with 30Y at 5.19% near multi-year highs; ZB consolidating 108.31-110.00 awaiting Sep 1 ISM/JOLTs for directional catalyst; Bessent buyback doubling acknowledged as partial offset to supply pressure but not a game-changer; COT short covering reflects positioning ahead of data rather than tactical reversal
This Week's Catalysts & Drivers
Primary driver: 30-year yield at 5.19% (Aug 28) consolidating after -8bp weekly decline from 5.27% as CFTC COT Aug 25 shows non-commercial short covering of -31,769 contracts and Treasury buyback doubling (Bessent Aug 19, $4B/op starting Sep 9) provides official-sector demand tailwind, yet structural fiscal supply pressure ($1.8T FY2026 deficit) and elevated term premiums cap upside
Secondary factor: Week-ahead catalyst cluster: ISM Manufacturing PMI (Sep 1, est 55.3 vs 55.6 prior), JOLTs (Sep 1), ADP Employment (Sep 2), and Beige Book (Sep 2) create binary data risk that could break the 108.31-110.00 consolidation range; Polymarket prices 55.0-55.9 ISM band at 32% probability suggesting modest cooling
Additional influence: CFTC COT Aug 25: non-commercial net short -187,243 contracts (-8.9% OI, 6.3rd 3-year percentile) with weekly short covering of 31,769 contracts — positioning remains extreme but momentum has shifted from building shorts to reducing them, removing some squeeze urgency but still at contrarian levels historically associated with rallies
Economic backdrop: Fed on hold at 3.63% with market expectations potentially shifting toward Sep rate hike per J.P. Morgan; inflation at 2.31% (Aug 28) near target but sticky; unemployment 4.1% stable; VIX around 14-15 signals risk-on equity posture while bonds remain structurally pressured by fiscal concerns creating DIVERGENT macro regime; macro regime classification: DIVERGENT — equities risk-on (VIX < 20, HY spreads tight at 275bp) while long bonds continue pricing fiscal deterioration risk
Fundamental assessment: 30Y yield at 5.19% down 8bp weekly from 5.27% 19-year highs; Bessent's Aug 19 buyback doubling to $4B/op targeting 20-30yr sector from Sep 9 is the key fundamental development — direct official-sector demand intervention partially offsetting $1.8T FY2026 deficit supply pressure; foreign holdings declined $72.1B in June TIC data; term premium elevated keeping structural bearish pressure intact
Technical Picture
Sideways consolidation between 108.31 (52-week low) and 110.00 (round number resistance); price at 109.6875 at the 12.5th percentile of 52-week range; RSI neutral after +0.75% 1W gain; no clear pattern; volume declining suggesting positioning ahead of data rather than conviction breakout
At 3/10, trend strength is subdued, suggesting the market lacks a clear directional mandate.
Bull & Bear Case
Primary risk: Break below 108.3125 52-week low on stronger-than-expected ISM/JOLTs data reigniting hawkish repricing and validating structural bearish thesis, triggering stop-loss cascades toward 107.00 major support as 30Y yields push back above 5.30% and the Bessent buyback is deemed insufficient to absorb supply deluge (Probability: medium)
Primary opportunity: Dovish ISM print below 55.0 confirming manufacturing slowdown combined with extreme COT short positioning (6.3rd percentile) and month-end pension rebalancing buying triggers short squeeze above 110.00 resistance toward 112.00, with Treasury buyback program starting Sep 9 providing further support for a 2-3% rally from current levels (Timeframe: Next 1-2 weeks through Sep 1 ISM/JOLTs data and into Sep 9 when Treasury buyback operations begin, provided data confirms economic cooling and allows the contrarian squeeze setup to materialize from extreme bearish positioning)
This week's edge: Below Min Signal threshold — synthesized |signal| of 0.40 falls well below ZB's 1.1 Min Signal requirement, mandating NO CALL per Rule 2. Probable weekly move of 0.5-0.7% straddles the volatility-adjusted Noise Floor (0.65% after +0.15% low-vol regime adjustment for BOND category), further reinforcing neutrality. The critical structural observation to monitor: CFTC COT Aug 25 shows non-commercial net short at -187,243 contracts (6.3rd percentile) with the first material short covering in weeks (-31,769 contracts), combined with Treasury Secretary Bessent's Aug 19 buyback doubling ($4B/op from Sep 9) and month-end pension rebalancing (Aug 31 est $14bn buying per Goldman Sachs) — creating a tactical window where official-sector and structural demand meet extreme speculative short positioning. However, this remains a market structure observation, not an actionable directional edge, as the Sep 1 ISM/JOLTs data is required to resolve the tension between structural supply headwinds and the Bessent intervention. The absence of a catalyst strong enough to break the 108.31-110.00 consolidation before data arrives prevents directional conviction.
Volatility Regime
Volatility for T-bond futures is at the 28th percentile over 90 days — a compressed regime where breakout potential builds beneath the surface. The vol trend is flat, with no meaningful shift across timeframes. Stable vol environments often lull traders before a regime change arrives.
Volatility in low-normal regime signaling reduced near-term breakout probability; daily ranges compressing toward 0.4-0.6 handles from 0.8-1.0 during post-FOMC selloff; stop widths should remain tight at 0.5-0.7 handles; 108.3125 support and 110.00 resistance are critical with narrowing ranges suggesting accumulation/distribution ahead of Sep 1 data; given BOND category low-vol adjustment, effective noise floor rises to ~0.65%
What to Watch
The ISM Manufacturing PMI (Aug) at 14:00 UTC — estimate 55.3 vs prior 55.6; concurrent JOLTs Job Openings (Jul) est 7.39M vs 7.359M; first major data since Aug 26 PCE and key test of economic momentum narrative on Tuesday 1 September stands as the week's primary risk event — high-impact and capable of overriding the existing technical and sentiment setup.
The interplay between consolidating market conditions and upcoming catalysts will define this week's trading landscape for ZB futures.
This analysis covers one dimension. Our full weekly report combines six specialist agents into a single actionable briefing with directional bias, key levels, and risk-opportunity matrix.
Start Free — Get the Market of the WeekFree weekly report · No credit card · Upgrade anytime



