30-Year Treasury Forecast This Week — Outlook, Drivers & Key Levels
This week's 30-Year Treasury outlook: key drivers, volatility context, risk-opportunity assessment and the week ahead.

Market Overview
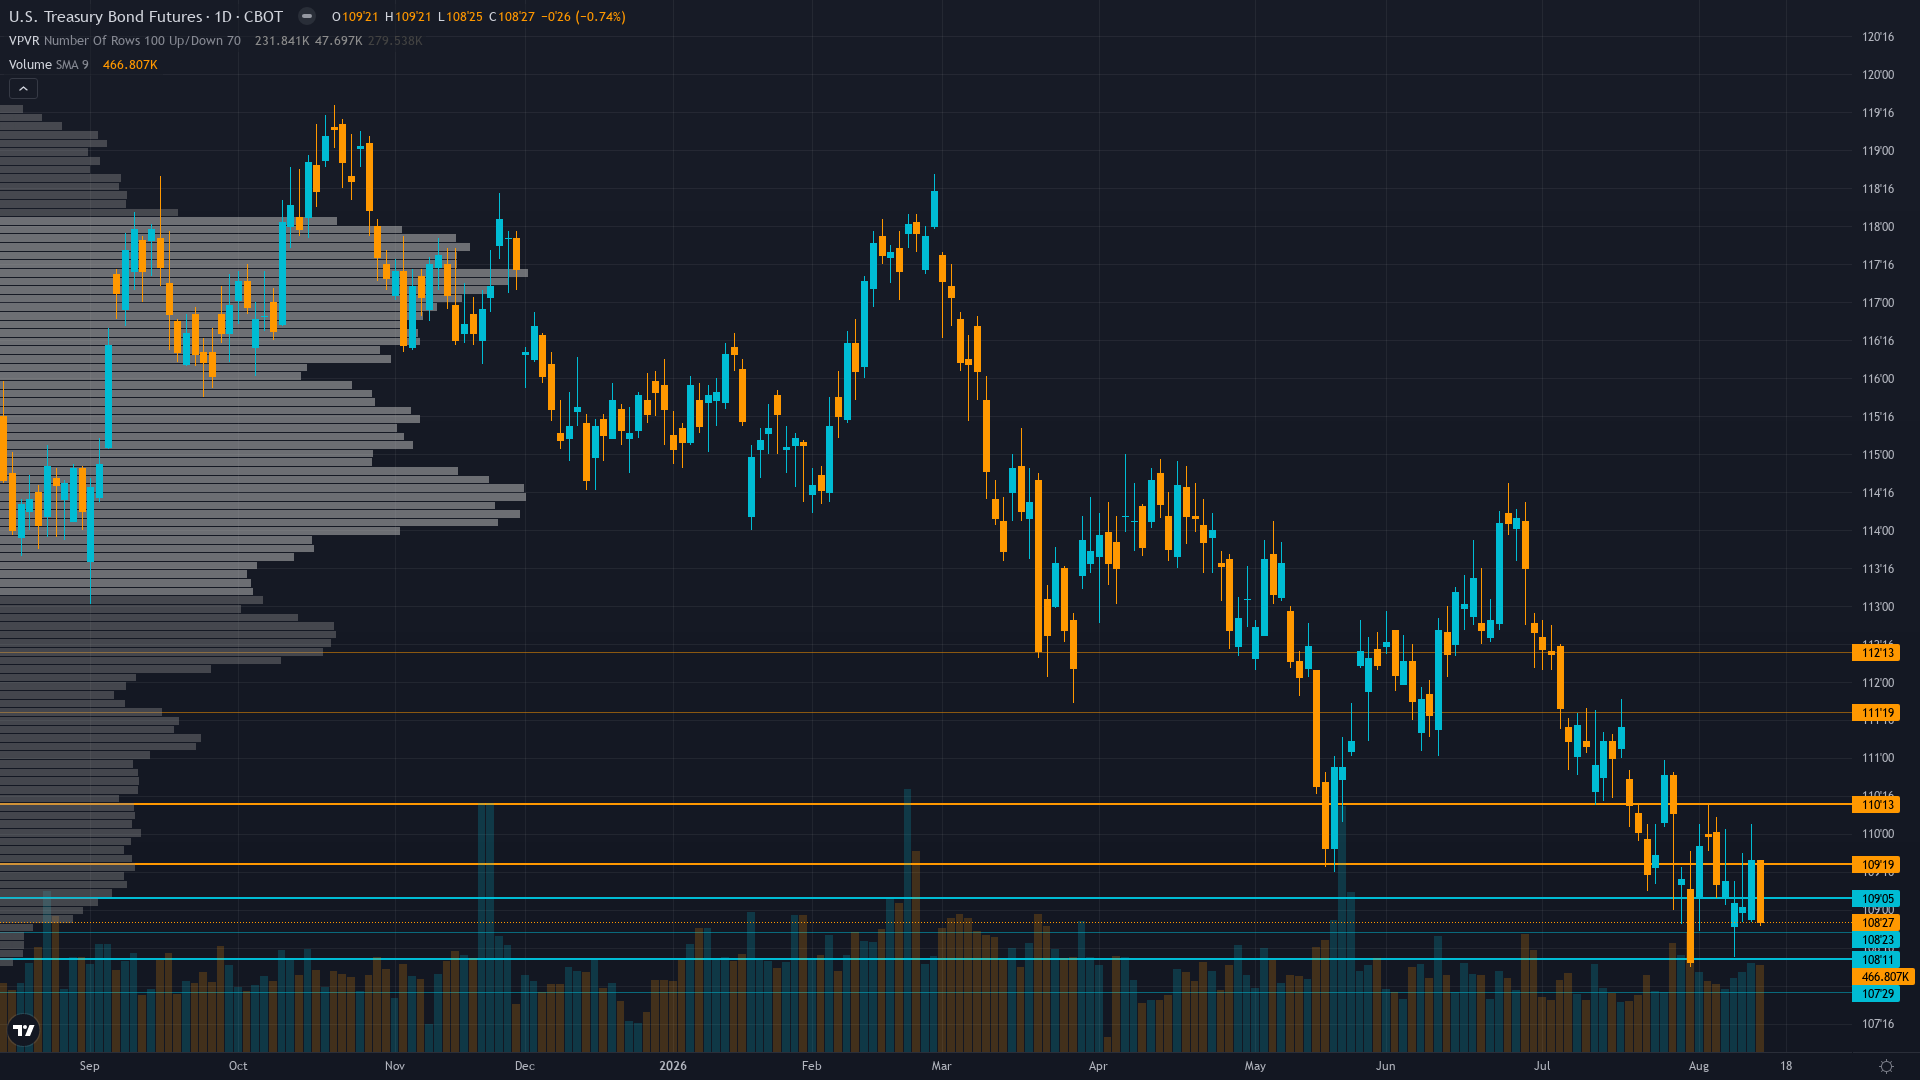
30-year Treasury holds at 108.84, off 0.28% in a modest retracement from recent levels. Treasury bond futures is range-bound and tightening, with decreasing volatility signalling a directional resolution ahead.
Market pricing structural bearish duration environment with 30Y at 25-year highs of 5.25-5.27%; ZB consolidating near 52-week low 108.31 awaiting August 17-18 data for direction; extreme COT short positioning at 7.6th percentile acknowledged but not acted upon without catalyst
This Week's Catalysts & Drivers
Primary driver: 30-year yield at 5.25-5.27% (August 14, 2026) at 25-year highs with August 13 auction clearing at 5.216% — highest since 2001 — structurally bearish supply/demand dynamics dominate but are fully priced near 52-week low at 108.31, creating tactical equilibrium between fiscal deficit fears and contrarian squeeze potential from extreme COT short positioning at 7.6th percentile
Secondary factor: Post-input development: Bloomberg August 14 reports Bessent 'gets a warning on deficits from the bond market' as $40T national debt and $1.8T FY2026 deficit (CBO August 2026) drive term premium expansion; CNBC August 14 confirms 30Y yield surged 6bp to 5.267% on retail sales data; costliest 30Y auction since 2001 cleared at 5.216% with decent demand per Bloomberg August 13 — supply absorption intact but at punishing yield levels
Additional influence: CFTC COT August 11, 2026 shows non-commercial net short -179,607 contracts at 7.6th percentile of 3-year range — extreme bearish speculative crowding that historically precedes mean-reversion rallies; MOVE index at 69.58 down 8.59% weekly reflecting declining volatility pressure as market consolidates near lows with no fresh catalyst for acceleration
Economic backdrop: Fed funds at 3.63% on extended hold; inflation at 2.27% (August 14) modestly above prior 2.24%; unemployment stable at 4.1%; retail sales showing slight decline; market expecting Fed on hold through 2026 per J.P. Morgan; curve steep (2s10s 51bp, 10s30s 57bp) reflecting term premium repricing for fiscal risk
Fundamental assessment: 30Y yield at 5.25-5.27% (25-year high); FY2026 deficit $1.8T through first 10 months structural supply pressure; August 13 30Y auction cleared at 5.216% with decent demand suggesting yield is finding buyers at these levels but at punishing cost; term premium elevated
Technical Picture
Daily downtrend intact at 108.84 approaching 52-week low 108.31; price well below estimated 50-day (~112-113) and 200-day MAs; RSI likely oversold but without bullish divergence; break below 108.31 could trigger acceleration to 107.00 major support
At 4/10, trend strength is middling — enough to suggest a lean, but not enough to trade with high confidence.
Bull & Bear Case
Primary risk: Break below 108.31 52-week low triggers accelerated selling toward 107.00 on sustained fiscal supply concerns and/or hawkish Fed rhetoric, representing additional 1.5-2.0% downside from current levels as stop-loss cascades amplify selling (Probability: medium)
Primary opportunity: Dovish surprise in upcoming data (Housing Starts, Industrial Production) combined with extreme COT short positioning at 7.6th percentile triggers violent short squeeze rally above 109.50 resistance toward 112.00, representing 2-3% upside from current levels as crowded shorts rush to cover (Timeframe: Next 1-2 weeks through August 17-18 data releases and August 27-28 Jackson Hole Symposium if softer data validates disinflation and triggers mean reversion from extreme bearish positioning)
This week's edge: Below Min Signal threshold — synthesized |signal| of 0.40 falls well below 1.1 Min Signal requirement mandating NO CALL per Rule 2. The critical edge to monitor: CFTC COT as of August 11, 2026 shows non-commercial net short at -179,607 contracts (7.6th percentile of 3-year range), within striking distance of the 3-year minimum of -239,646, creating asymmetric squeeze potential should any data surprise dovish. This extreme positioning is a market structure observation, not a directional call — the absence of a catalyst to resolve the tension between structural supply and positioning extremes prevents actionable bias. The Bessent 'deficit warning' narrative (Bloomberg August 14) and the 5.216% 30Y auction (August 13) represent the bearish case already priced. The contrarian opportunity exists but requires a trigger that does not yet exist. Current consolidation near the 52-week low with contracting MOVE at 69.58 suggests the market awaits the next catalyst rather than independently breaking down or reversing.
Volatility Regime
Volatility for T-bond futures is at the 28th percentile over 90 days — a compressed regime where breakout potential builds beneath the surface. The vol trend is down, with contraction across timeframes creating the kind of coiled conditions that historically resolve explosively.
Volatility contracting into low regime signaling reduced breakout probability in near term; daily ranges compressing toward 0.4-0.6 handles from 0.8-1.0 during post-FOMC selloff; stop widths should tighten accordingly; 108.31 support level is critical with narrowing ranges suggesting accumulation or distribution ahead of next catalyst
What to Watch
The NY Empire State Manufacturing Index (Aug) at 12:30 ET; NAHB Housing Market Index (Aug) at 14:00 ET; Net Long-Term TIC Flows (Jun) at 20:00 ET — critical for foreign demand assessment on Monday 17 August stands as the week's primary risk event — high-impact and capable of overriding the existing technical and sentiment setup.
The interplay between consolidating market conditions and upcoming catalysts will define this week's trading landscape for ZB futures.
This analysis covers one dimension. Our full weekly report combines six specialist agents into a single actionable briefing with directional bias, key levels, and risk-opportunity matrix.
Start Free — Get the Market of the WeekFree weekly report · No credit card · Upgrade anytime



