30-Year Treasury Forecast This Week — Outlook, Drivers & Key Levels
This week's 30-Year Treasury outlook: key drivers, volatility context, risk-opportunity assessment and the week ahead.

Current Market Picture
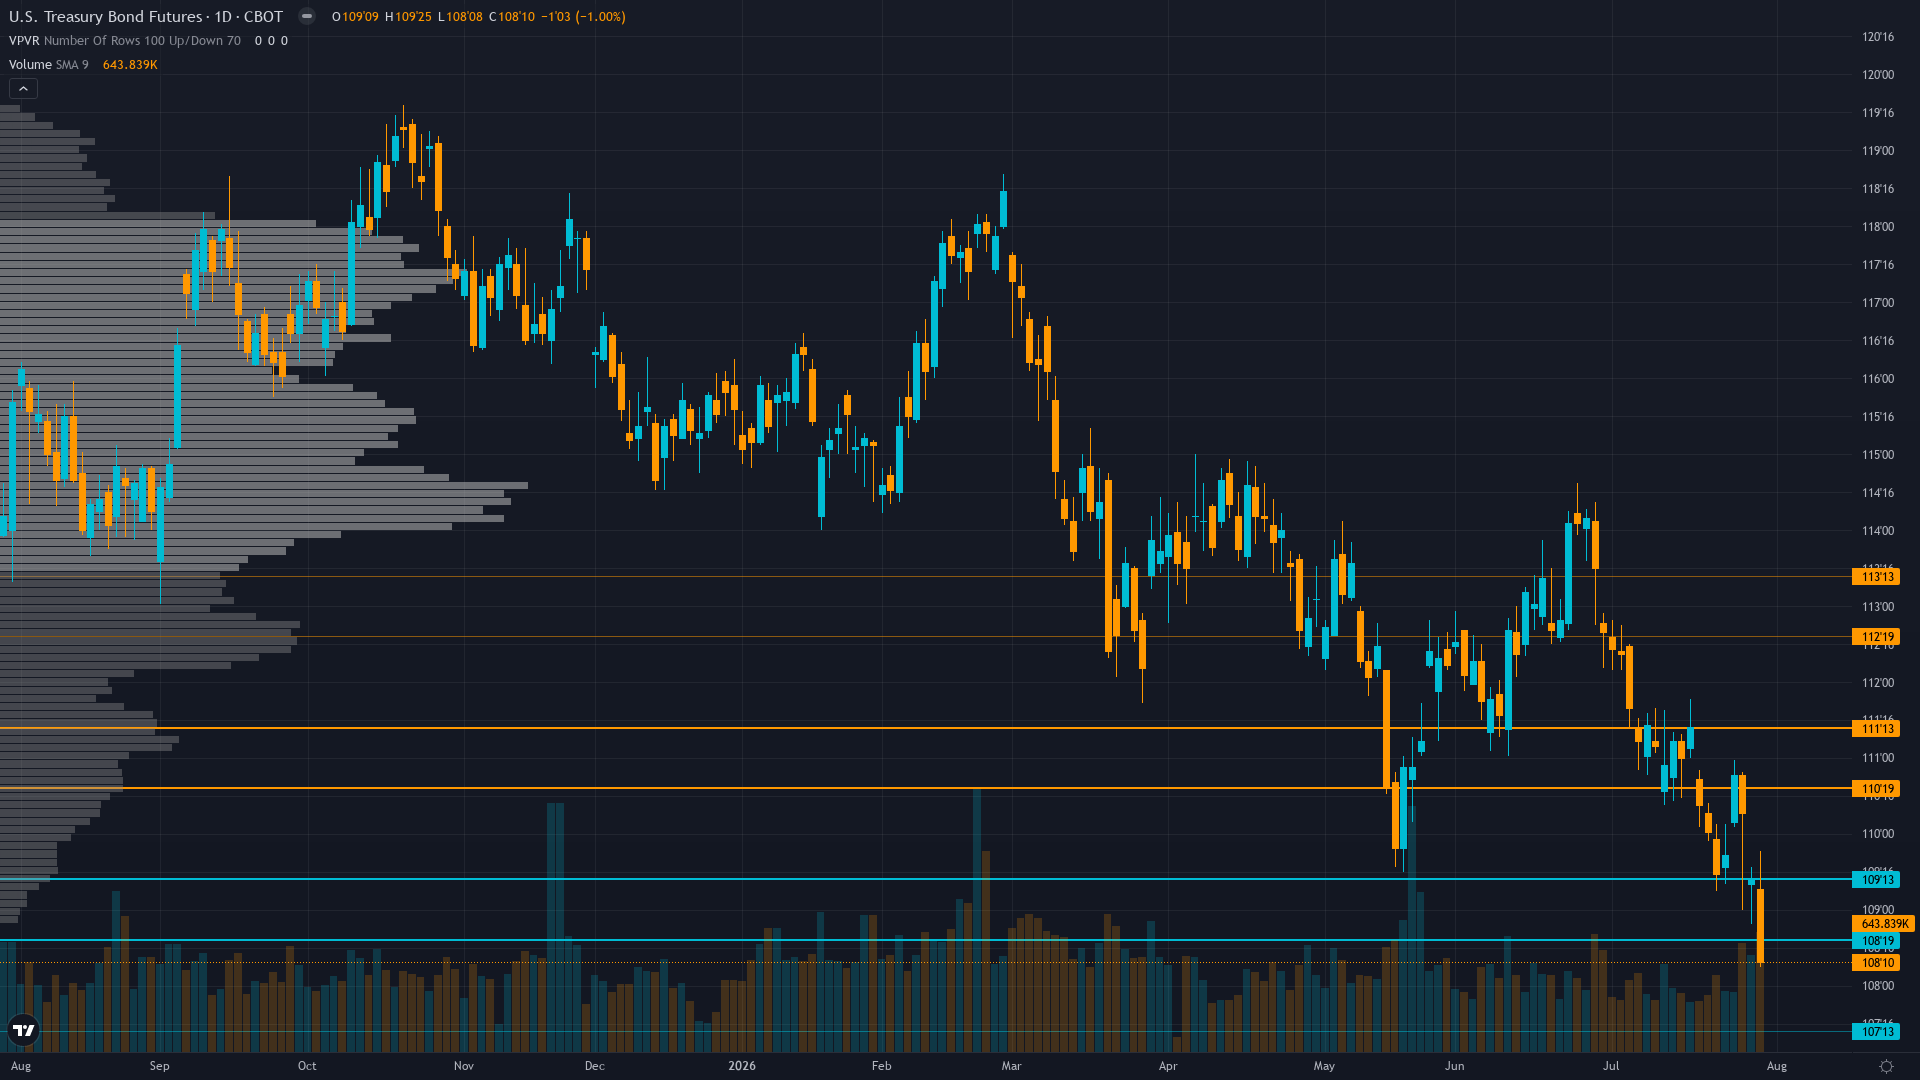
Trading at 108.75 after a 1.05% slide, 30-year Treasury faces sustained selling interest. Treasury bond futures is in a breaking down market state, requiring careful assessment of current conditions.
Market pricing Fed on extended hold after July 29 9-3 decision with 3 officials wanting hike — yields surging to 5.27-5.28% on 30Y, bonds in breakdown as supply pressure and sticky inflation dominate duration pricing; consensus broadly bearish on bonds awaiting August 7 employment and August 12 CPI for next catalyst
Key Drivers This Week
Primary driver: FOMC July 29 9-3 hold with THREE officials dissenting wanting hike — materially hawkish outcome that triggered yield surge to 5.27-5.28% on 30Y (19-year highs) per CNBC July 31 as oil prices and rate-hike rhetoric reinforce structural bearish repricing of duration
Secondary factor: Technical breakdown confirmed — ZB at 108.75 after closing at 108.3125 on July 31 (Yahoo Finance), decisively below 108.25 immediate support with 50-day MA near 112.00 and 200-day MA near 115.50, RSI below 40 with elevated volume on selloff creating cascade risk toward 106.00 major support
Additional influence: Post-input FOMC development NOT fully reflected in stale discipline data — CNBC July 31 confirms 'Treasury yields follow oil prices higher as Fed officials say rate hikes are needed' while 3 FOMC dissenters wanted a hike, representing material hawkish catalyst that reinforces bearish thesis but occurred after this week's analysis cut-off creating data staleness risk for discipline inputs
Economic backdrop: Macro regime is TRANSITIONAL with risk-on tilt — VIX at 16.82 (below 20) signaling contained equity volatility yet bonds breaking down in safe-haven paradox as Fed 9-3 hold with 3 hike dissenters (July 29) plus oil-driven inflation concerns (CNBC July 31) reinforce higher-for-longer narrative; August 7 employment and August 12 CPI are next key catalysts; 10Y at 4.75% (StreetStats July 31)
Fundamental assessment: FY2026 deficit at $1.37T through June with $2T projected — structural supply pressure not fully priced; 30Y at 5.27-5.28% above long-term average 4.74% (YCharts July 31); term premium compressed versus historical norms; Treasury auctions Aug 3-6 critical absorption test; foreign demand softening per TIC data
Price Structure
Confirmed downtrend since April 7 peak near 114.75 with lower highs and lower lows intact; current 108.75 below 108.25 immediate support break — last week's NO CALL graded CORRECT with -0.71% decline validating breakdown; bearish MA alignment with price well below both 50-day (112.00) and 200-day (115.50) MAs; declining OI at 1.86M confirms trend weakness; RSI below 40 bearish momentum
Trend strength sits at 6/10, reflecting a market that has directional bias but hasn't reached extreme conviction.
Upside & Downside
Primary risk: Flight-to-safety rally in bonds despite supply pressure — if equity markets correct sharply or credit markets stress, Treasury demand could surge overwhelming supply dynamics and triggering violent short-covering rally from current oversold levels above 111.00 toward 113.00 zone representing 2-3% upside (Probability: medium)
Primary opportunity: Continued breakdown below 108.25 support toward 106.00 major support on hawkish FOMC follow-through as 9-3 vote signals genuine policy division with 3 officials wanting hikes, combined with oil-driven inflation persistence and August Treasury supply deluge, creating extended bearish cascade representing additional 2-3% decline from current levels (Timeframe: Next 1-3 weeks through August 7 employment and August 12 CPI data if inflation remains sticky and supply absorption weakens)
This week's edge: Signal strength exceeds Min Signal threshold (|signal| ~1.2 > 1.1) and probable weekly move (0.8-1.5%) exceeds Noise Floor (0.50%) — technical conditions for directional call are met. However, mandatory conviction floor enforcement forces NO CALL due to 2-miss streak dropping conviction to 4 (below 5/10 threshold). The desk's analysis identifies that the market may be UNDERPRICING the significance of the 9-3 FOMC vote with 3 officials wanting a hike — a level of FOMC dissent not seen since October 1992 (8-4 vote under Powell's predecessor context). Combined with oil-driven inflation concerns (CNBC July 31) and the upcoming August quarterly refunding announcement with Treasury supply deluge, this creates asymmetric downside risk that the current yield surge to 5.27% may only be the beginning of a repricing toward 5.50-5.75% on 30Y if August 7 employment and August 12 CPI confirm inflation stickiness. Yet this edge cannot be acted on this week due to conviction floor — the framework correctly forces restraint given the consecutive miss streak. If this week's NO CALL grades correctly and the breakdown continues, conviction will reset for next week.
Volatility Context
At the 55th percentile, T-bond futures volatility sits in a normal range, neither compressed enough to signal a breakout nor elevated enough to demand caution. Realised vol is trending higher across the curve, which tends to accompany transitional periods where the market is repricing risk.
Volatility expanding from compressed regime creating favorable conditions for directional breakouts; daily ranges expanding from 0.4-0.6 handles during pre-FOMC calm toward 0.8-1.2 handles as post-FOMC repricing accelerates; current 108.75 price testing critical 108.25 support with elevated volume (473K) suggesting genuine breakdown rather than noise; stop widths should widen to accommodate 1.0-1.5 handle daily swings
Week Ahead Outlook
The next major catalyst is Treasury quarterly refunding announcement (first Wednesday of August — August 5, 2026 anticipated) plus Treasury auctions August 3, 4, and 6 providing updated borrowing estimates and supply absorption data; August 7 employment report at 8:30 AM ET; August 12 CPI release on Monday 3 August — a high-impact event that could materially shift the directional picture.
For long bond, the balance between existing momentum and scheduled risk events sets the stage for the week ahead.
This analysis covers one dimension. Our full weekly report combines six specialist agents into a single actionable briefing with directional bias, key levels, and risk-opportunity matrix.
Start Free — Get the Market of the WeekFree weekly report · No credit card · Upgrade anytime



