30-Year Treasury Forecast This Week — Outlook, Drivers & Key Levels
This week's 30-Year Treasury outlook: key drivers, volatility context, risk-opportunity assessment and the week ahead.

Market Overview
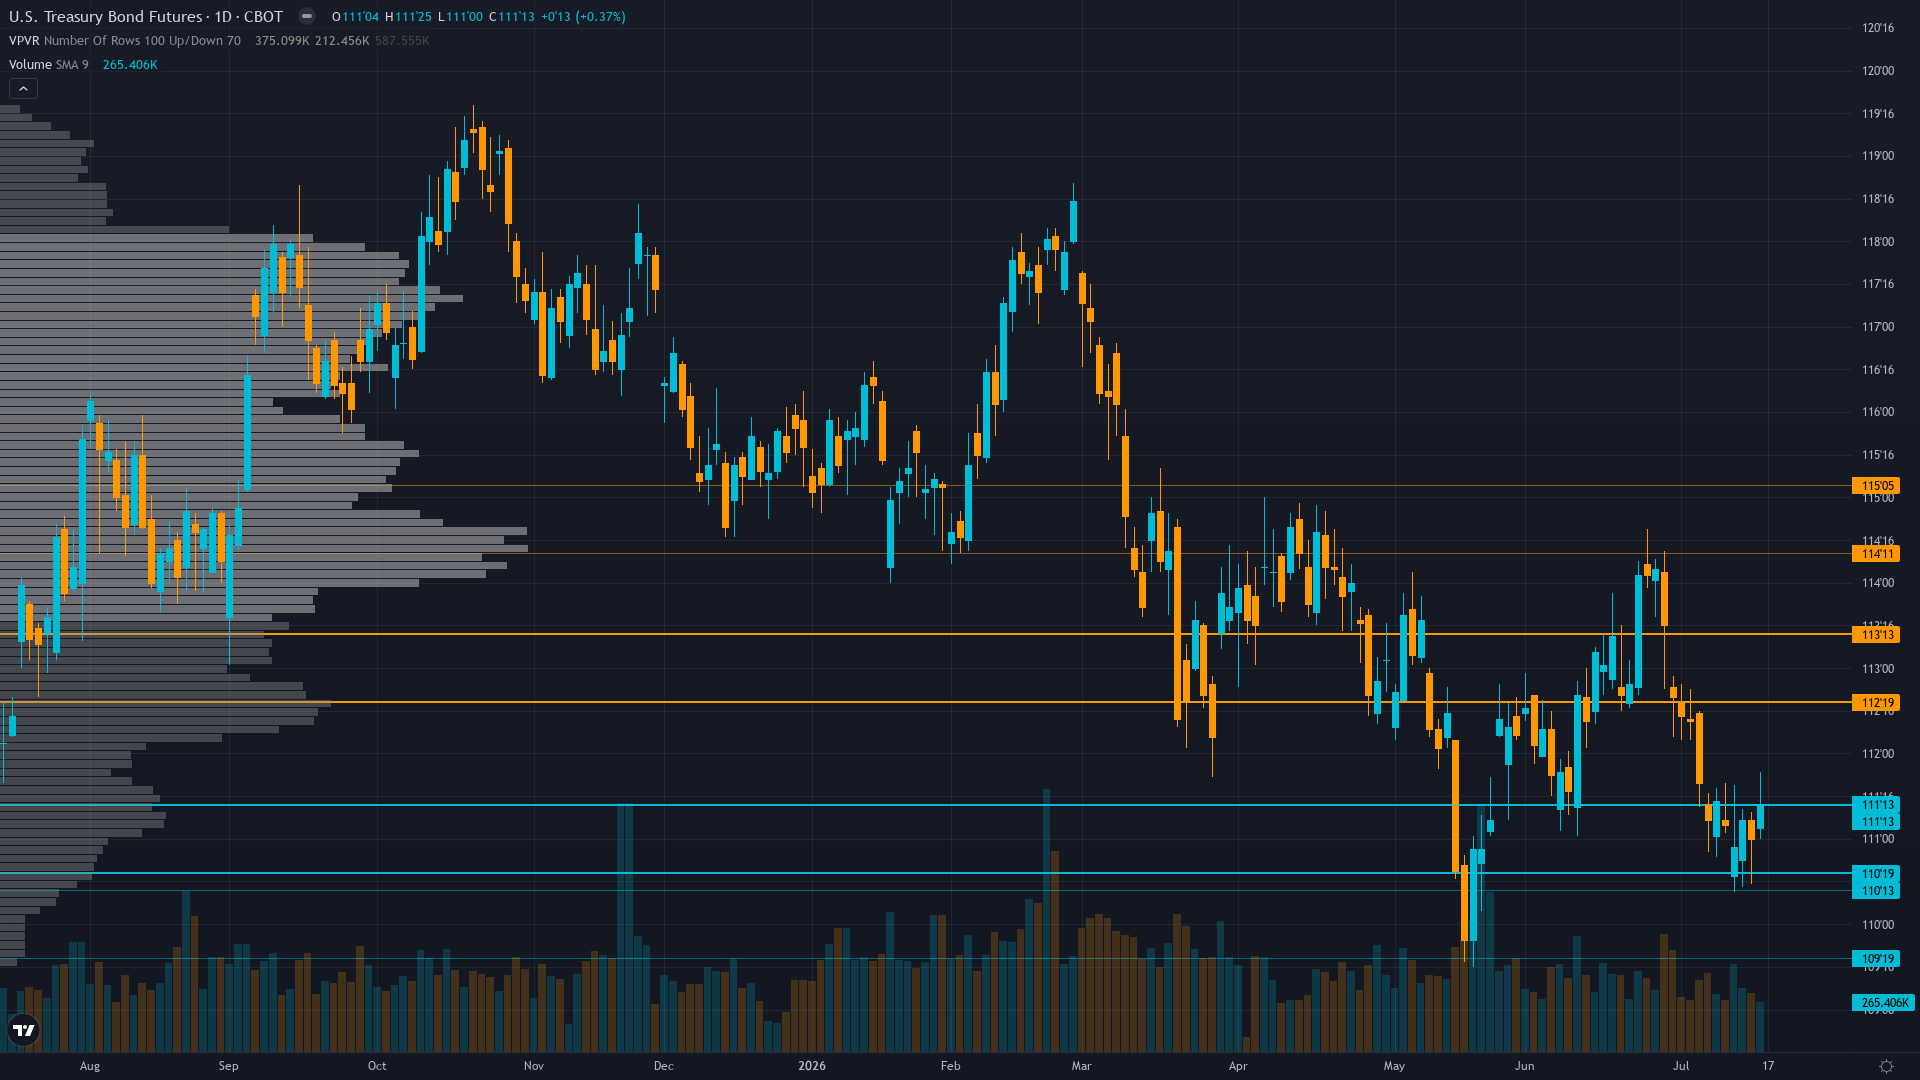
30-year Treasury holds at 110.625, up a marginal 0.28% as the market grinds forward. Treasury bond futures is in a testing critical support after last week MISSED call market state, requiring careful assessment of current conditions.
Market pricing Fed on hold at July 28-29 FOMC with 95% probability maintaining 3.50-3.75% range per Polymarket; bonds consolidating 110-112 awaiting FOMC clarity on whether June 14 CPI -0.4% dovish surprise shifts forward guidance from June 17 hawkish dot plot with 9 members projecting 2026 hikes
This Week's Catalysts & Drivers
Primary driver: Post-input development identified: June CPI released July 14 (5 days ago) showed -0.4% monthly decline bringing annual inflation to 3.5% from prior 4.2% representing FRESH MATERIAL DOVISH CATALYST that creates direct tension with June 17 hawkish June dot plot yet occurred after last week analysis creating regime-shifting repricing environment with July 28-29 FOMC 9 days away
Secondary factor: Last week July 10 BEARISH call MISSED with +0.28% rally from 111.03 to 111.34375 placing consecutive miss streak at 1 triggering Rule 3 penalty minus 1 yet bias streak now at 4 consecutive weeks approaching 5-week mandatory review threshold requiring fresh thesis justification from first principles
Additional influence: Cross-discipline 1-versus-5 conflict with Economic +2.5 confidence 7 heavily bullish on June CPI dovish surprise contradicting Fundamental -2.0, Technical -2.0, Institutional -1.5, Sentiment +0.5, Options +0.5 creating severe dissent from highest-weighted discipline (0.35) measuring lowest reliability (47%) in INDEX/BOND class yet fresh catalyst weight elevates signal
Economic backdrop: Post-input development identified: June CPI released July 14 showed -0.4% monthly decline bringing annual inflation to 3.5% versus higher consensus creating FRESH DOVISH CATALYST occurring 5 days ago that contradicts June 17 hawkish dot plot; next FOMC July 28-29 (9 days away) with market pricing 95% hold probability yet June CPI data creates genuine policy uncertainty about forward guidance shift
Fundamental assessment: Fed at 3.50-3.75% following June 17 FOMC with dot plot showing 9 of 18 members projecting 2026 rate hikes yet June CPI released July 14 showed -0.4% monthly decline to 3.5% annual creating fundamental tension between hawkish guidance and dovish data reality; FY2026 deficit at $1.4T through 9 months maintains structural supply pressure
Technical Picture
Confirmed downtrend since April 7 peak at 114.75 with lower highs and lower lows intact; current 110.625 testing critical 110.0 immediate support with bearish MA alignment as price sits well below 50-day MA ~113.00; declining open interest at 1.85M validates weakening trend conviction yet last week rally suggests potential reversal
At 3/10, trend strength is subdued, suggesting the market lacks a clear directional mandate.
Bull & Bear Case
Primary risk: July 28-29 FOMC delivers hawkish rhetoric despite June CPI dovish surprise emphasizing June 17 dot plot with 9 members projecting rate hikes maintaining restrictive stance forcing market to reprice terminal rate higher sending ZB below 110.0 support toward 108 major support with cascade potential representing additional 2-3% decline from current 110.625 levels (Probability: medium)
Primary opportunity: July 28-29 FOMC acknowledges June CPI -0.4% dovish surprise by shifting forward guidance from June 17 hawkish stance toward acknowledging disinflation progress removing rate hike probability from dot plot triggering violent short covering rally above 112.0 resistance toward 114-115 zone from current washed-out positioning with MOVE at 68.16 creating asymmetric upside from compressed volatility levels representing potential 15-20% MOVE expansion to 80-85 range (Timeframe: Next 9 days through July 28-29 FOMC if Fed pivots toward acknowledging disinflation reality versus maintaining June 17 hawkish guidance creating 3-4% upside move potential from current 110.625 toward 114-115 resistance zone)
This week's edge: Market potentially underpricing magnitude of dovish shift implied by June 14 CPI -0.4% monthly decline to 3.5% annual versus June 17 hawkish dot plot—consensus pricing 95% hold at July FOMC yet only 5% hike probability suggests market expects acknowledgment of disinflation reality creating asymmetric upside if Fed delivers dovish forward guidance removing rate hike probability from dot plot triggering rally above 112 toward 114-115 resistance from current 110.625 oversold levels; alternatively market may be underpricing Warsh's commitment to June 17 hawkish stance despite contradicting data creating extended breakdown risk below 110 support toward 108 representing additional 2-3% decline; probable weekly move 0.7-0.9% exceeds 0.50% Noise Floor with fresh 5-day catalyst yet 9-day void until FOMC limits conviction to moderate threshold given cross-discipline 1v5 conflict and consecutive miss streak at 1
Volatility Regime
Volatility for T-bond futures is at the 28th percentile over 90 days — a compressed regime where breakout potential builds beneath the surface. The vol trend is down, with contraction across timeframes creating the kind of coiled conditions that historically resolve explosively.
Volatility compression creating false calm environment; daily ranges compressing from 1.0-1.5 handles during May-June breakdown toward current 0.5-0.75 handles as MOVE declines to multi-year lows; current 110.625 price testing 110.0 support with July 28-29 FOMC creating near-term binary catalyst that could force violent breakout in either direction with expected 1.5-2.0 handle daily swings post-decision representing 1.3-1.8% moves creating tactical setup for directional positioning into event rather than range-bound neutrality
What to Watch
The FOMC policy decision July 28-29 with statement 2:00 PM July 29 and press conference 2:30 PM; market pricing 95% hold probability maintaining 3.50-3.75% range per Polymarket yet June 14 CPI -0.4% monthly decline to 3.5% annual creates binary catalyst for dovish forward guidance shift acknowledging disinflation progress versus maintaining June 17 hawkish dot plot stance with 9 members projecting 2026 hikes on Tuesday 28 July stands as the week's primary risk event — high-impact and capable of overriding the existing technical and sentiment setup.
The interplay between testing critical support after last week MISSED call market conditions and upcoming catalysts will define this week's trading landscape for ZB futures.
This analysis covers one dimension. Our full weekly report combines six specialist agents into a single actionable briefing with directional bias, key levels, and risk-opportunity matrix.
Start Free — Get the Market of the WeekFree weekly report · No credit card · Upgrade anytime



