30-Year Treasury Forecast This Week — Outlook, Drivers & Key Levels
This week's 30-Year Treasury outlook: key drivers, volatility context, risk-opportunity assessment and the week ahead.

This Week's Starting Point
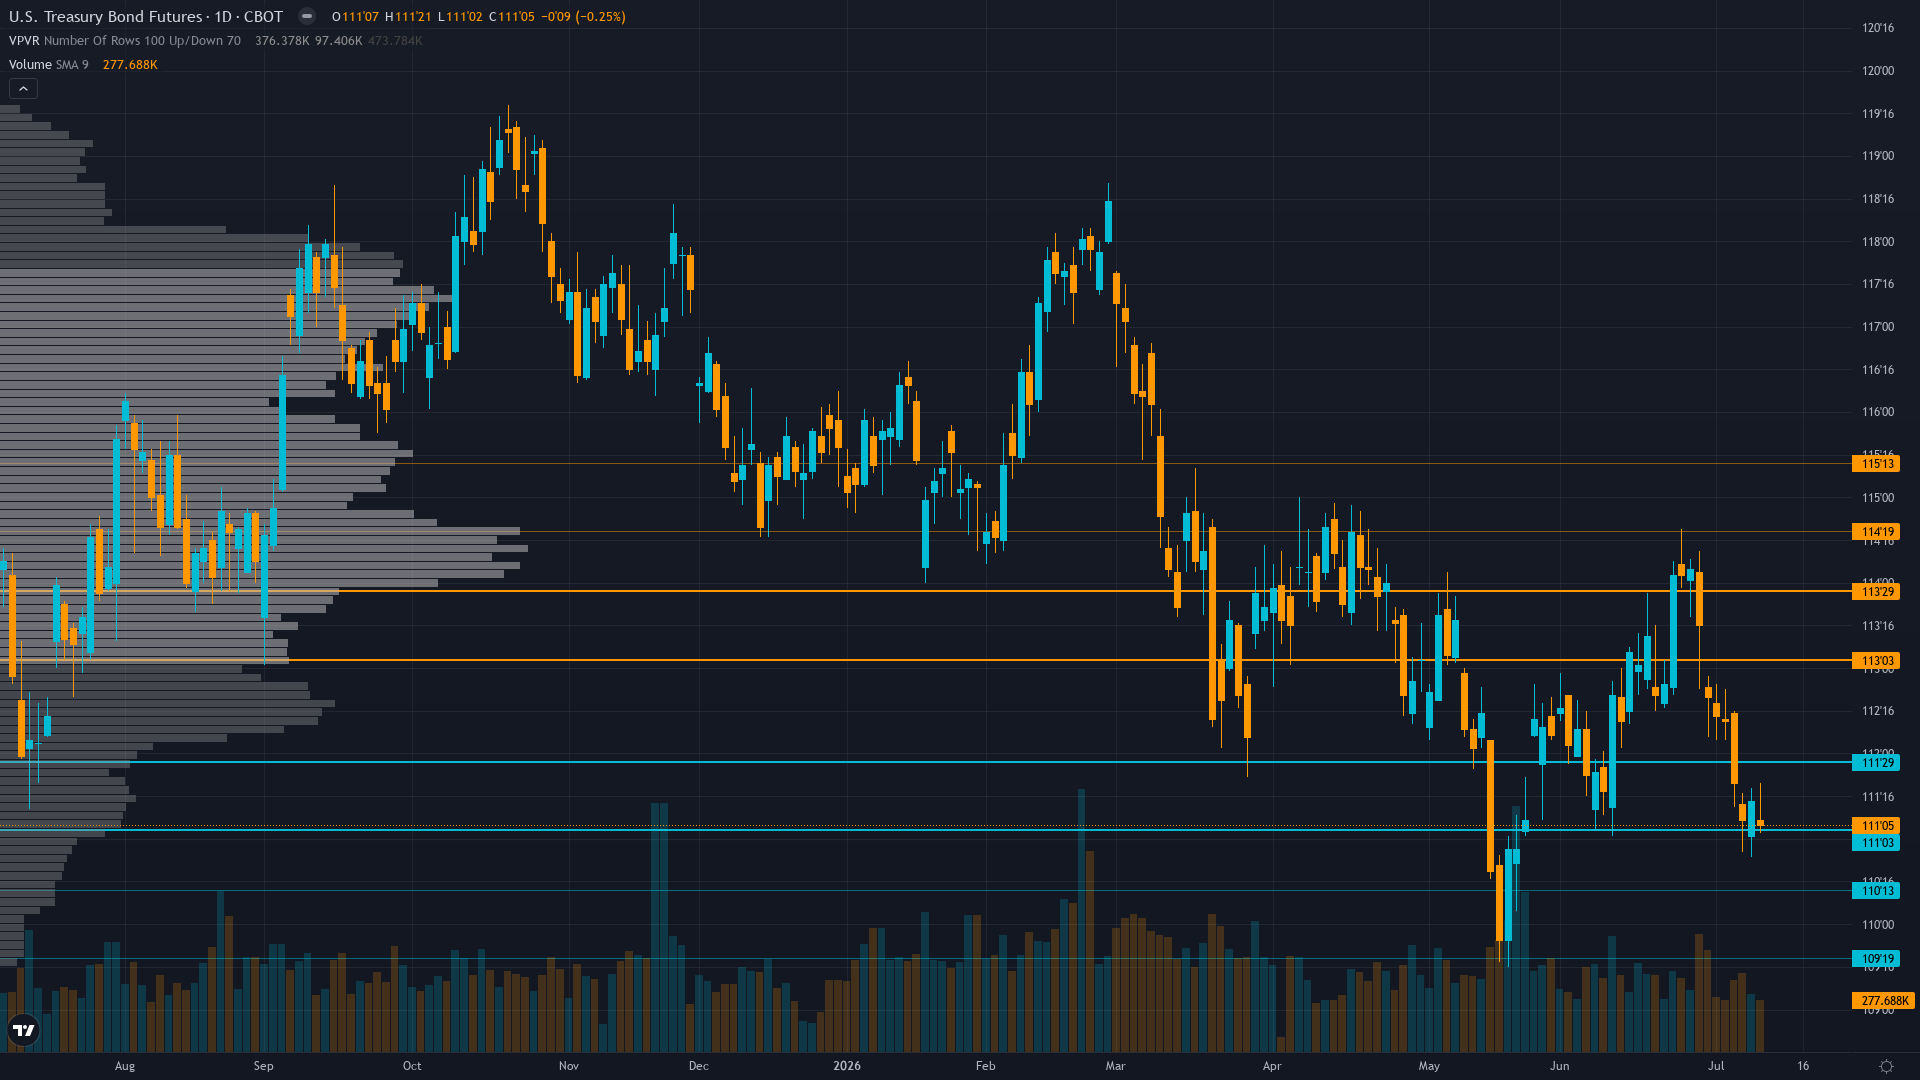
30-year Treasury sits at 111.03 after slipping 0.50% — a shallow pullback rather than a decisive move. Treasury bond futures is in a testing critical support within downtrend market state, requiring careful assessment of current conditions.
Market pricing Fed on hold at July 28-29 FOMC with 78% probability maintaining 3.50-3.75% range per Polymarket; bonds consolidating 110-114 awaiting July 14 CPI clarity on whether yesterday's June 4.0% spike represents persistent trend or transitory outlier with Warsh's June 17 hawkish pivot widely recognized as structural shift
Forces in Play
Primary driver: Post-input development identified: June CPI released July 11 (yesterday) showed 4.0% YoY inflation with 0.6% MoM acceleration—well above Fed 2% target and representing fresh hawkish repricing catalyst occurring within 24 hours that validates continuation of bearish structural thesis while current price 111.03 tests critical 111.00 immediate support with breakdown risk toward 110.00 major support
Secondary factor: Last two weeks BEARISH calls both CORRECT with -0.82% July 10 and -1.51% July 3 weekly declines resetting consecutive miss streak to zero yet bias streak reaches 4 consecutive BEARISH weeks approaching 5-week mandatory review threshold requiring fresh thesis justification while Economic Agent delivers highest conviction signal at -2.5 confidence 7 on yesterday's CPI acceleration
Additional influence: MOVE volatility at 69.55 down 9.71% monthly from elevated regime signals extreme compression to multi-year lows creating dangerous complacency before July 28-29 FOMC binary catalyst yet cross-discipline split exists with 5 bearish agents (Economic, Technical, Fundamental, Institutional, Options) versus only Sentiment +1.5 mild bullish creating unbalanced 5v1 consensus
Economic backdrop: Post-input development identified: June CPI released July 11 (yesterday) printed 4.0% YoY well above Fed 2% target validating sticky inflation environment; next FOMC July 28-29 (16 days away) with 78% hold probability per Polymarket yet fresh inflation acceleration creates genuine policy uncertainty about forward guidance; no major data until July 14 CPI creating low-information 2-day void
Fundamental assessment: Fed at 3.50-3.75% following June 17 Warsh FOMC removing easing bias with market pricing 78% hold probability at July 28-29 meeting yet yesterday's June CPI 4.0% YoY with 0.6% MoM acceleration represents fresh hawkish catalyst removing rate cut urgency through Q3-Q4 2026; FY2026 deficit at $1.9T maintains structural supply pressure
Technical Landscape
Confirmed downtrend making lower highs and lower lows since April 7 peak at 114.75; current 111.03 testing critical 111.00 immediate support with bearish MA alignment intact as price sits well below both 50-day MA ~113.50 and 200-day MA ~115.00; declining open interest at 1.88M validates weakening trend conviction
Trend strength sits at 4/10, reflecting moderate directional pressure without clear dominance.
Risk-Reward Assessment
Primary risk: Continued breakdown below 111.00 immediate support on sustained inflation persistence from yesterday's June CPI 4.0% forcing market to reprice Fed terminal rate higher or extend hawkish hold period through Q4 2026 sending ZB toward 110.00 major support with cascade potential representing additional 0.9% decline from current 111.03 levels as yields push toward 4.70-4.80% range (Probability: medium)
Primary opportunity: July 14 CPI shows material deceleration below 0.2% MoM core contradicting yesterday's June 4.0% outlier forcing Fed to acknowledge higher-for-longer stance creating excessive labor market damage triggering violent short covering rally above 113.0 resistance toward 114-115 zone from current washed-out positioning with MOVE expansion from 69.55 toward 80-85 range creating asymmetric upside (Timeframe: Next 2-3 weeks through July 14 CPI release and July 28-29 FOMC if data deteriorates significantly creating 15-20% MOVE expansion representing potential 1.5-2.0 handle daily swings post-catalyst)
This week's edge: Market potentially underpricing magnitude of hawkish repricing required from yesterday's June CPI 4.0% acceleration combined with Warsh's June 17 removal of easing bias—consensus pricing 78% hold at July FOMC yet only 22% hike probability suggests complacency about inflation persistence forcing extended hawkish hold through Q4 2026 creating breakdown risk below 111.00 toward 110.00 support representing additional 0.9% decline. Alternatively market may be overpricing hawkish risk if yesterday's CPI proves transitory outlier with July 14 release showing deceleration forcing Fed pivot acknowledgment creating asymmetric upside from current washed-out positioning. Probable weekly move 0.7-0.9% exceeds Noise Floor with fresh 24-hour catalyst yet 16-day void until July FOMC limits conviction to minimum threshold.
Risk Environment
With vol compressed to the 28th percentile, T-bond futures is in the kind of quiet period that tends to end abruptly when a catalyst arrives. Volatility is contracting, with realised vol declining across timeframes. Compressed volatility often precedes sharp directional moves as energy builds.
Volatility compression creating false calm environment; daily ranges compressing from 1.0-1.5 handles during May-June breakdown toward current 0.5-0.75 handles as MOVE declines to multi-year lows; current 111.03 price testing 111.0 support with July 28-29 FOMC creating near-term binary catalyst that could force violent breakout in either direction with expected 1.5-2.0 handle daily swings post-decision representing 1.3-1.8% moves
Looking Forward
All eyes turn to FOMC policy decision July 28-29 with statement 2:00 PM July 29 and press conference 2:30 PM; market pricing 78% hold probability maintaining 3.50-3.75% range per Polymarket yet yesterday's June CPI 4.0% acceleration combined with Warsh's June 17 hawkish pivot creates binary catalyst for duration repricing if forward guidance emphasizes inflation persistence over labor market support on Tuesday 28 July, which carries enough weight to force a decisive directional move.
The week ahead for Treasury bond futures hinges on whether the prevailing testing critical support within downtrend regime can absorb the scheduled catalysts without a regime shift.
This analysis covers one dimension. Our full weekly report combines six specialist agents into a single actionable briefing with directional bias, key levels, and risk-opportunity matrix.
Start Free — Get the Market of the WeekFree weekly report · No credit card · Upgrade anytime



