30-Year Treasury COT & Institutional Positioning — Smart Money Analysis
30-Year Treasury institutional positioning: COT data, sentiment analysis and smart money flow assessment.

Where Institutions Stand
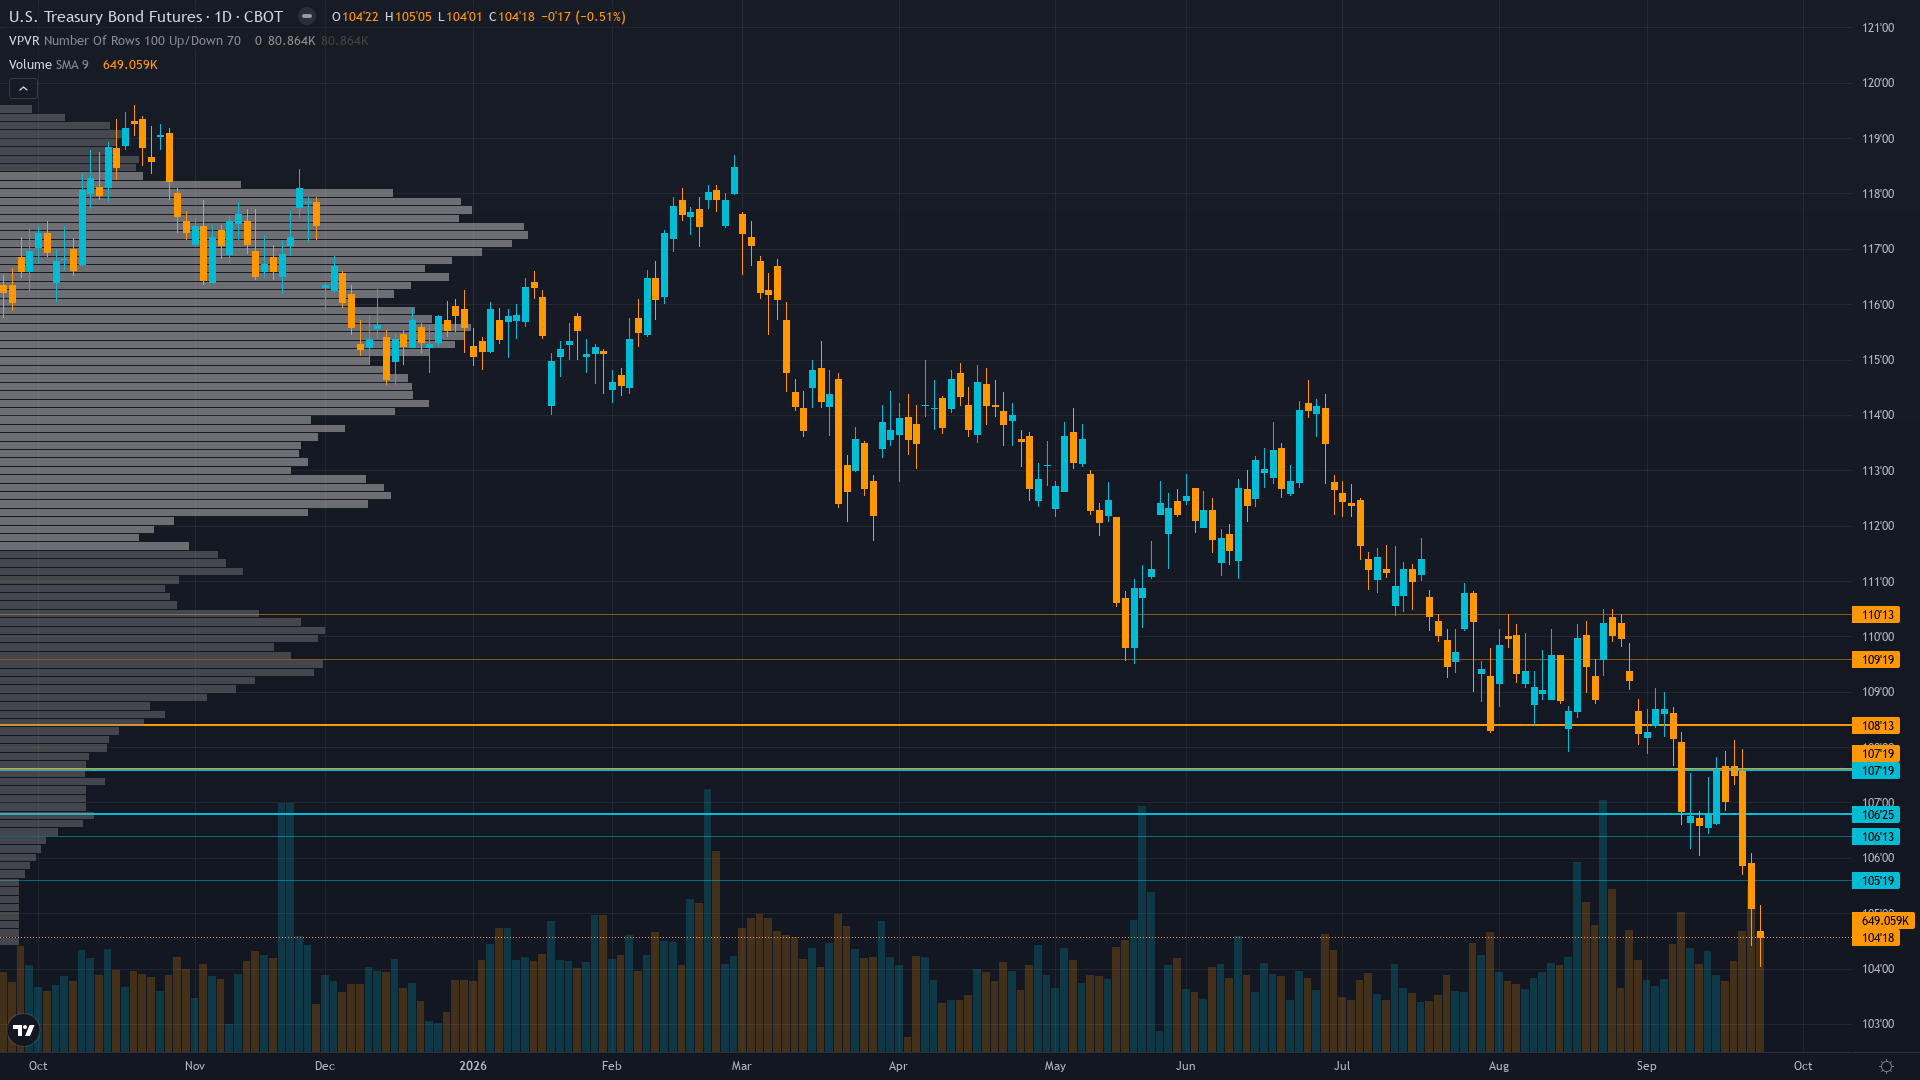
30-year Treasury sits at 104.6875 after slipping 0.51% — a shallow pullback rather than a decisive move.
CFTC COT Sep 22: non-commercial net short -155,805 contracts (14.6th percentile, -8.3% of OI), improving +47,352 week-over-week as shorts covered into the -2.79% crash toward the 52-week low; quarter-end rebalancing Sep 30 may add pension duration demand; Bessent $4B/op buyback program running through Nov 4 provides official-sector bid at the long end — covering underway but positioning still contrarian
Consensus vs MAD View
Market consensus: Market pricing structural bearish duration environment with 30Y at 5.49-5.50% (2004 highs); ZB crashing to 52-week low after -2.79% weekly collapse accelerated by hawkish Fed repricing pricing 65-71% probability of October 25bp hike; MOVE Index spiking 30% to 104 confirming bond market panic; Bessent buyback ongoing but insufficient to absorb supply deluge from $1.97T fiscal deficit
Primary driver: Accelerating bond selloff pushing 30-year yield to 5.49-5.50% (highest since 2004) driven by hawkish Fed repricing after Sep 16 25bp hike, with Polymarket and CME FedWatch now pricing 65-71% probability of another 25bp hike at the Oct 28 FOMC meeting — the structural tightening cycle that began with Warsh's June 17 removal of easing bias has escalated into a full repricing of the terminal rate path through 2027
Where the Crowd May Be Wrong
Low-to-mild divergence: desk's BEARISH bias aligns with consensus bearish market pricing (30Y at 2004 highs, 65-71% Oct hike probability, COT shorts still extreme at 14.6th percentile), but the desk identifies meaningful blindspots in the market's pricing of near-term squeeze potential from the MOVE spike to 104, the aggressive short covering underway (-47,352 contracts), the Bessent buyback program, and quarter-end pension rebalancing on Sep 30 — factors the consensus is not actively pricing as marginal upside catalysts against the relentless structural bearish narrative, though the overall directional alignment keeps the divergence score moderate at 28
Crowd Psychology
Neither side has committed heavily to Treasury bond futures, leaving sentiment in a neutral zone that offers little directional guidance on its own.
Options Flow
MOVE Index surged ~29.69% this week to ~104 (Bloomberg Sep 25, Cryptonomist Sep 25) — extreme spike reflecting capitulation in bond options as 30Y yields hit 2004 highs; ZB options implied volatility at 10.03% per Barchart now significantly above the 8.4% realised vol; rising MOVE confirms bond-specific volatility stress; this week's Fed speech cluster (6 officials Sep 28-29) and JOLTs data (Sep 29) represent binary event risk for further vol expansion or cathartic squeeze
The Bottom Line on Positioning
The positioning mosaic for long bond combines fear sentiment with expanding volatility conditions. Trend strength is elevated at 9/10, indicating strong directional conviction in current price action. Taken together, institutional behaviour, crowd psychology, and derivatives data frame the setup heading into the new week.
This analysis covers one dimension. Our full weekly report combines six specialist agents into a single actionable briefing with directional bias, key levels, and risk-opportunity matrix.
Start Free — Get the Market of the WeekFree weekly report · No credit card · Upgrade anytime


