30-Year Treasury COT & Institutional Positioning — Smart Money Analysis
30-Year Treasury institutional positioning: COT data, sentiment analysis and smart money flow assessment.

Smart Money Positioning
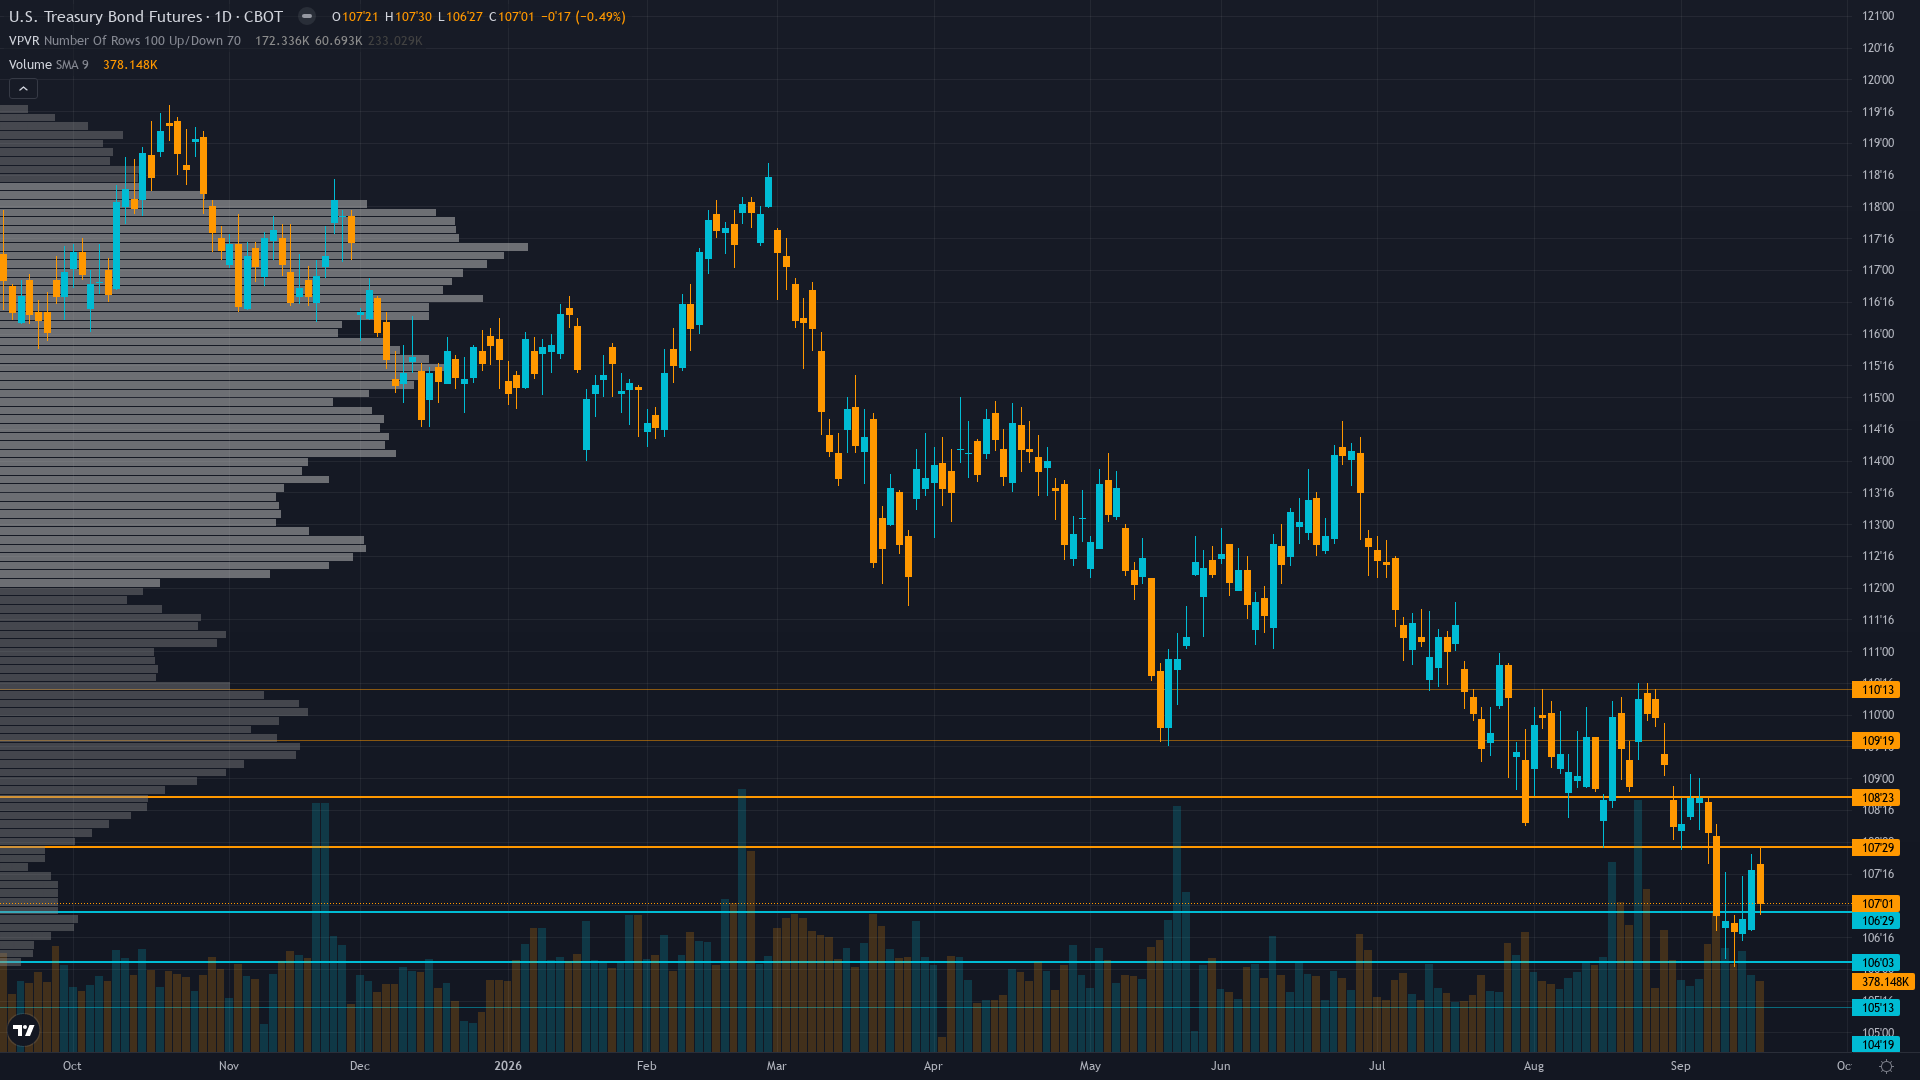
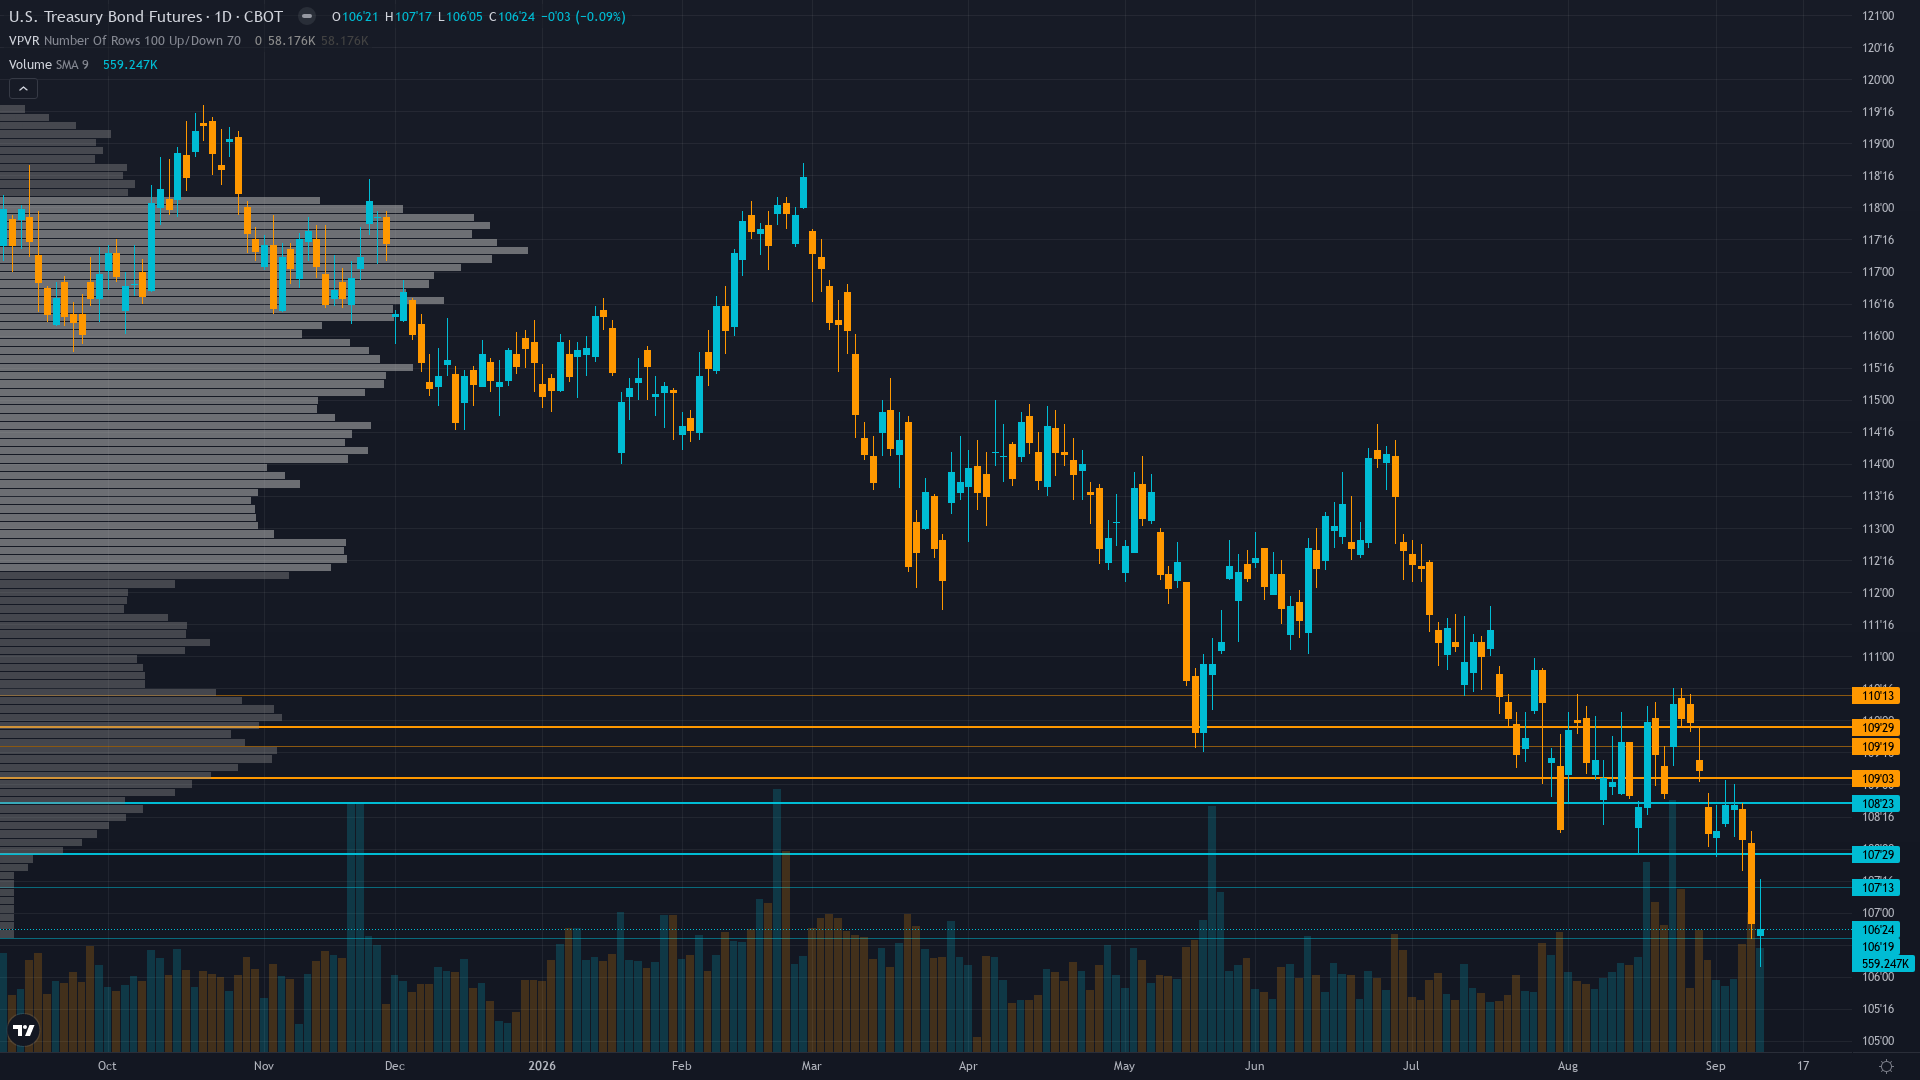
At 107.2813, 30-year Treasury has eased 0.17% in a controlled retreat.
CFTC COT Sep 8: non-commercial net short -200,517 contracts (-11.1% of OI, 3.8th percentile of 3-year range, near the 3-year minimum of -239,646) with speculators essentially flat week-over-week (-1,016 change); commercial net long 137,912 providing structural bid; hedge fund basis trade exposure at $830B creates vulnerability to forced deleveraging on vol spike; Treasury Secretary Bessent's $4B/op buyback program targeting 20-30yr sector began Sep 9 providing official-sector demand tailwind that partially offsets structural supply but has been insufficient to stem the selloff
Consensus Check
Market consensus: Market pricing structural bearish duration environment with 30Y at 5.36% (19-year highs); ZB breaking down below 108.31 52-week low toward 105-107 zone; FOMC Sep 16 dot plot expected to confirm hawkish tilt; J.P. Morgan and Capital Economics leaning toward rate hike; Bessent buyback acknowledged but deemed insufficient at current yield levels
Primary driver: 30-year yield at 5.36% (19-year highs per Trading Economics Sep 11) with ZB at the absolute 52-week low of 107.2813 after breaking below prior support at 108.31; structural bearish supply dynamics ($1.97T FY2026 deficit projections per Bloomberg Sep 11, declining foreign holdings to $9.299T in June 2026 per Trading Economics) now driving yield acceleration above the 5.30% resistance level with the 52-week low now acting as resistance rather than support
Divergence Assessment
Low-to-mild divergence: desk's BEARISH bias aligns with consensus bearish market positioning (COT 3.8th percentile, yields at 19-year highs), but the desk identifies an underappreciated squeeze asymmetry from the combination of extreme short crowding, the Bessent buyback program ($4B/op), and MOVE spike to 82.21 — factors the consensus is not actively pricing as marginal upside catalysts, though the overall directional alignment keeps the divergence score moderate at 25
Market Sentiment
The sentiment picture for Treasury bond futures is evenly split, providing no contrarian signal in either direction. The next move will likely be event-driven.
What Options Markets Show
MOVE Index at 82.21 (TradingView Sep 13) up 6.98% in 24h — significant spike from prior ~73-75 range indicating bond volatility expanding sharply ahead of FOMC; Schwab (Sep 9) notes MOVE rising steadily while VIX falls, signaling bond-specific stress not present in equity markets; post-input development confirmed: MOVE has broken above the 80 threshold which historically precedes outsized Treasury moves of 1.5-2.0% in either direction; elevated vol creates widening stop-loss thresholds but also amplifies breakout moves through stop cascades
Positioning Summary
Putting the positioning picture together for ZB futures: sentiment is fear, trend strength sits at 7/10, reflecting a market that has directional bias but hasn't reached extreme conviction. The net assessment from institutional data, crowd positioning, and derivatives activity points to a market where the balance of forces tilts in a discernible direction.
This analysis covers one dimension. Our full weekly report combines six specialist agents into a single actionable briefing with directional bias, key levels, and risk-opportunity matrix.
Start Free — Get the Market of the WeekFree weekly report · No credit card · Upgrade anytime