30-Year Treasury COT & Institutional Positioning — Smart Money Analysis
30-Year Treasury institutional positioning: COT data, sentiment analysis and smart money flow assessment.

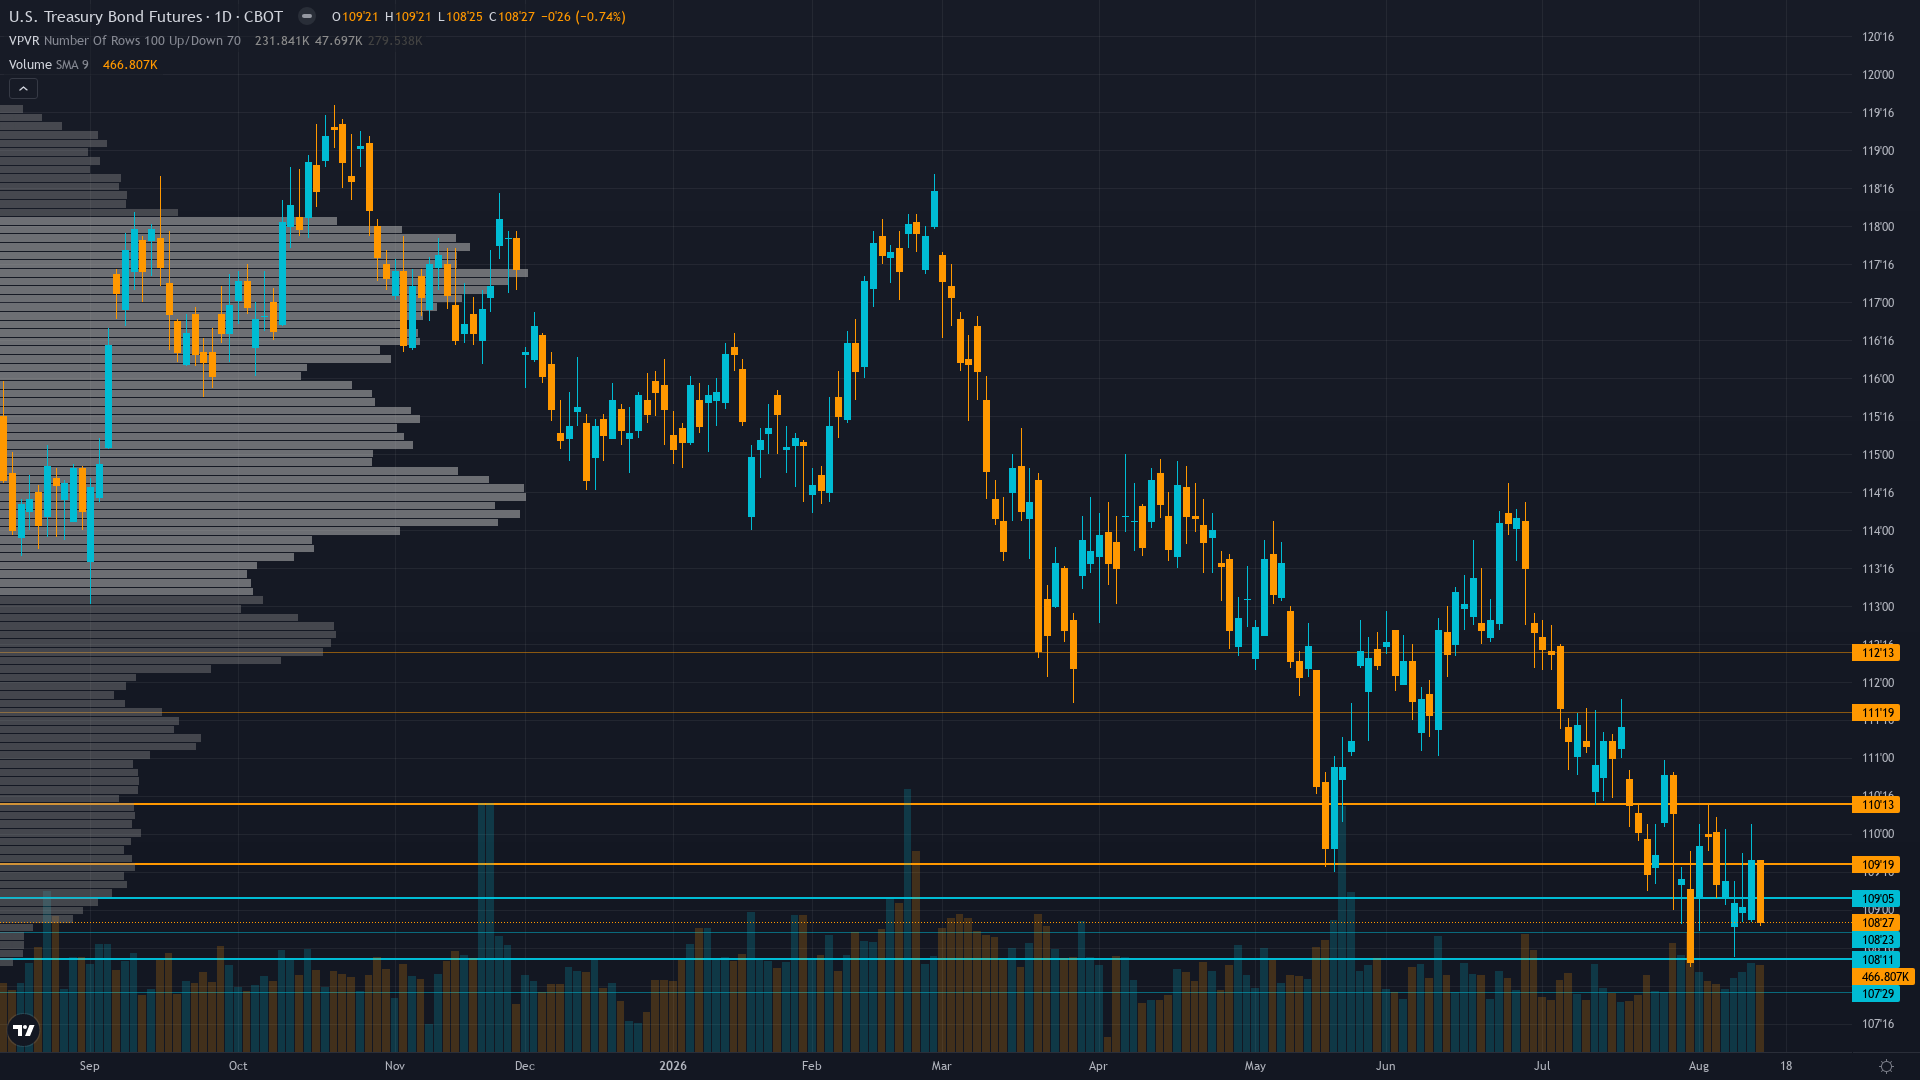
The Institutional Landscape
At 108.84, 30-year Treasury has eased 0.28% in a controlled retreat.
CFTC COT Aug 11: non-commercial net short -179,607 at 7.6th 3-year percentile — extreme bearish speculative crowding with slight -3,335 reduction in shorts week-over-week; major squeeze vulnerability but no trigger yet; open interest 1.86M stable
Market Consensus vs Our Analysis
Market consensus: Market pricing structural bearish duration environment with 30Y at 25-year highs of 5.25-5.27%; ZB consolidating near 52-week low 108.31 awaiting August 17-18 data for direction; extreme COT short positioning at 7.6th percentile acknowledged but not acted upon without catalyst
Primary driver: 30-year yield at 5.25-5.27% (August 14, 2026) at 25-year highs with August 13 auction clearing at 5.216% — highest since 2001 — structurally bearish supply/demand dynamics dominate but are fully priced near 52-week low at 108.31, creating tactical equilibrium between fiscal deficit fears and contrarian squeeze potential from extreme COT short positioning at 7.6th percentile
Contrarian Assessment
Low divergence — desk's NO CALL aligns with market's tactical neutrality near 52-week low; while extreme COT short positioning (7.6th percentile) represents a genuine contrarian setup, the sub-Min-Signal conditions and absence of a catalyst prevent actionable divergence; the structural bearish thesis (fiscal supply, extended Fed hold, elevated yields) is the dominant consensus narrative that limits divergence to low range
Sentiment & Positioning
Sentiment around Treasury bond futures is neutral, with no extreme positioning on either side. This balanced state often resolves when a catalyst breaks the equilibrium.
Options Market Signal
MOVE at 69.58 down 8.59% weekly and 7.27% monthly; volatility contracting from prior elevated levels as post-FOMC and post-auction uncertainty resolves; no directional skew signal available from options data; declining vol suggests market not pricing near-term breakout catalyst
Putting It Together
In summary, the positioning picture for 30-year Treasury reflects neutral conviction levels set against a consolidating market backdrop. Trend strength at 4/10 paints a picture of a market with some direction but lacking strong conviction. The interplay between smart money activity, retail sentiment, and options market signals will shape how this positioning resolves.
This analysis covers one dimension. Our full weekly report combines six specialist agents into a single actionable briefing with directional bias, key levels, and risk-opportunity matrix.
Start Free — Get the Market of the WeekFree weekly report · No credit card · Upgrade anytime



