30-Year Treasury COT & Institutional Positioning — Smart Money Analysis
30-Year Treasury institutional positioning: COT data, sentiment analysis and smart money flow assessment.

Institutional Positioning
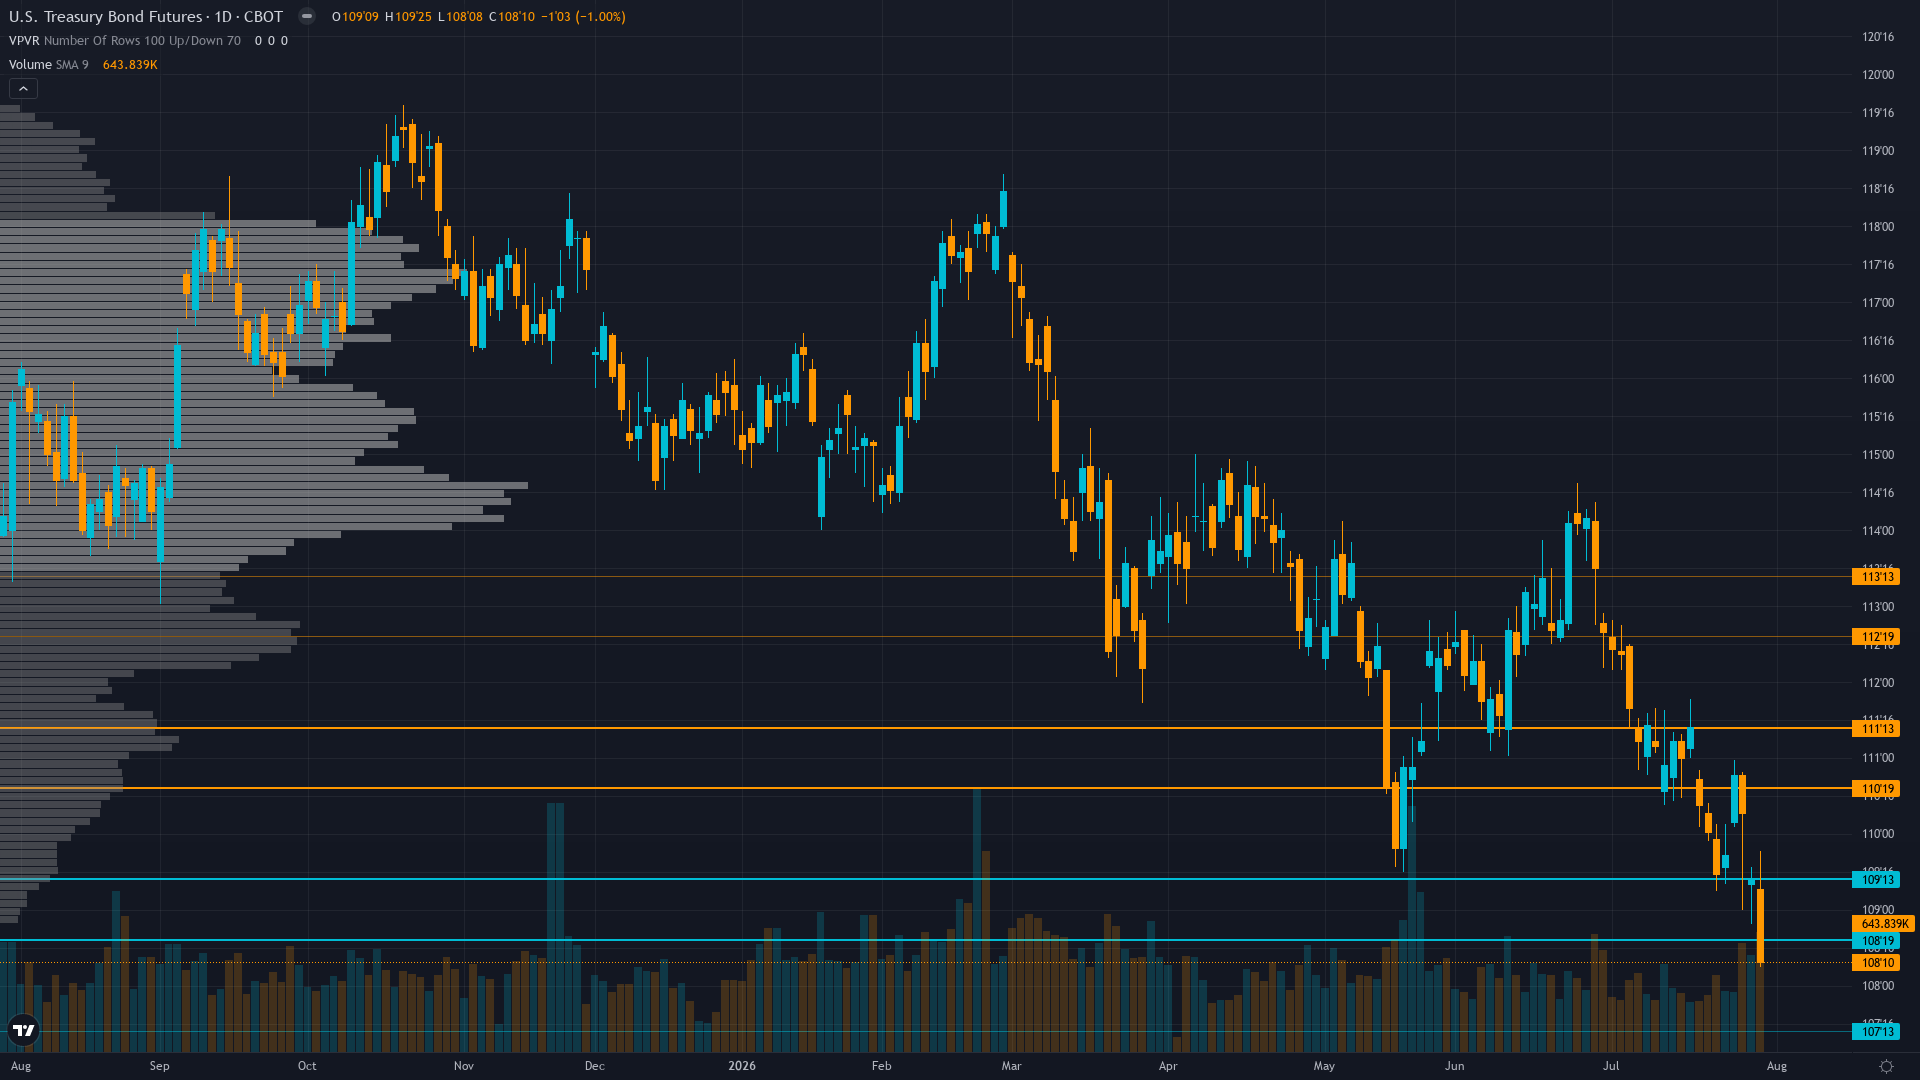
30-year Treasury fell to 108.75 on a 1.05% decline, with selling pressure dominating price action.
Unable to access current COT data per Institutional agent; declining open interest at 1.86M suggests participant deleveraging with short positioning likely building; Treasury auctions Aug 3-6 provide fresh supply absorption test
Where We Agree & Diverge
Market consensus: Market pricing Fed on extended hold after July 29 9-3 decision with 3 officials wanting hike — yields surging to 5.27-5.28% on 30Y, bonds in breakdown as supply pressure and sticky inflation dominate duration pricing; consensus broadly bearish on bonds awaiting August 7 employment and August 12 CPI for next catalyst
Primary driver: FOMC July 29 9-3 hold with THREE officials dissenting wanting hike — materially hawkish outcome that triggered yield surge to 5.27-5.28% on 30Y (19-year highs) per CNBC July 31 as oil prices and rate-hike rhetoric reinforce structural bearish repricing of duration
Consensus Gaps
Low divergence — desk's bearish lean broadly aligns with market consensus of hawkish FOMC, surging yields, and structural supply pressure; the primary divergence is the desk's assessment that the 9-3 vote with 3 hike dissenters may be underweighted relative to its historical significance (first multi-dissent hike-vote since 1992), but low conviction due to miss streak prevents this from being an actionable contrarian signal
Sentiment Analysis
Positioning in Treasury bond futures is balanced, with neither bulls nor bears holding a decisive edge. Neutral sentiment typically precedes a directional catalyst.
Derivatives Intelligence
MOVE Index at 77.09 (TradingView) up 3.93% in 24 hours from compressed levels — volatility regime expanding post-FOMC as market reprices hawkish risk; ZB IV at 8.20% (Barchart) remains depressed relative to MOVE suggesting options may underprice downside tail risk; put/call ratio data unavailable but MOVE expansion supports bearish vol bias
Net Assessment
The institutional landscape for T-bond futures shows fear sentiment. Trend strength registers at 6/10, suggesting meaningful but not extreme directional bias. The combination of positioning data, sentiment, and options flow provides context for understanding where smart money is leaning heading into the week.
This analysis covers one dimension. Our full weekly report combines six specialist agents into a single actionable briefing with directional bias, key levels, and risk-opportunity matrix.
Start Free — Get the Market of the WeekFree weekly report · No credit card · Upgrade anytime



