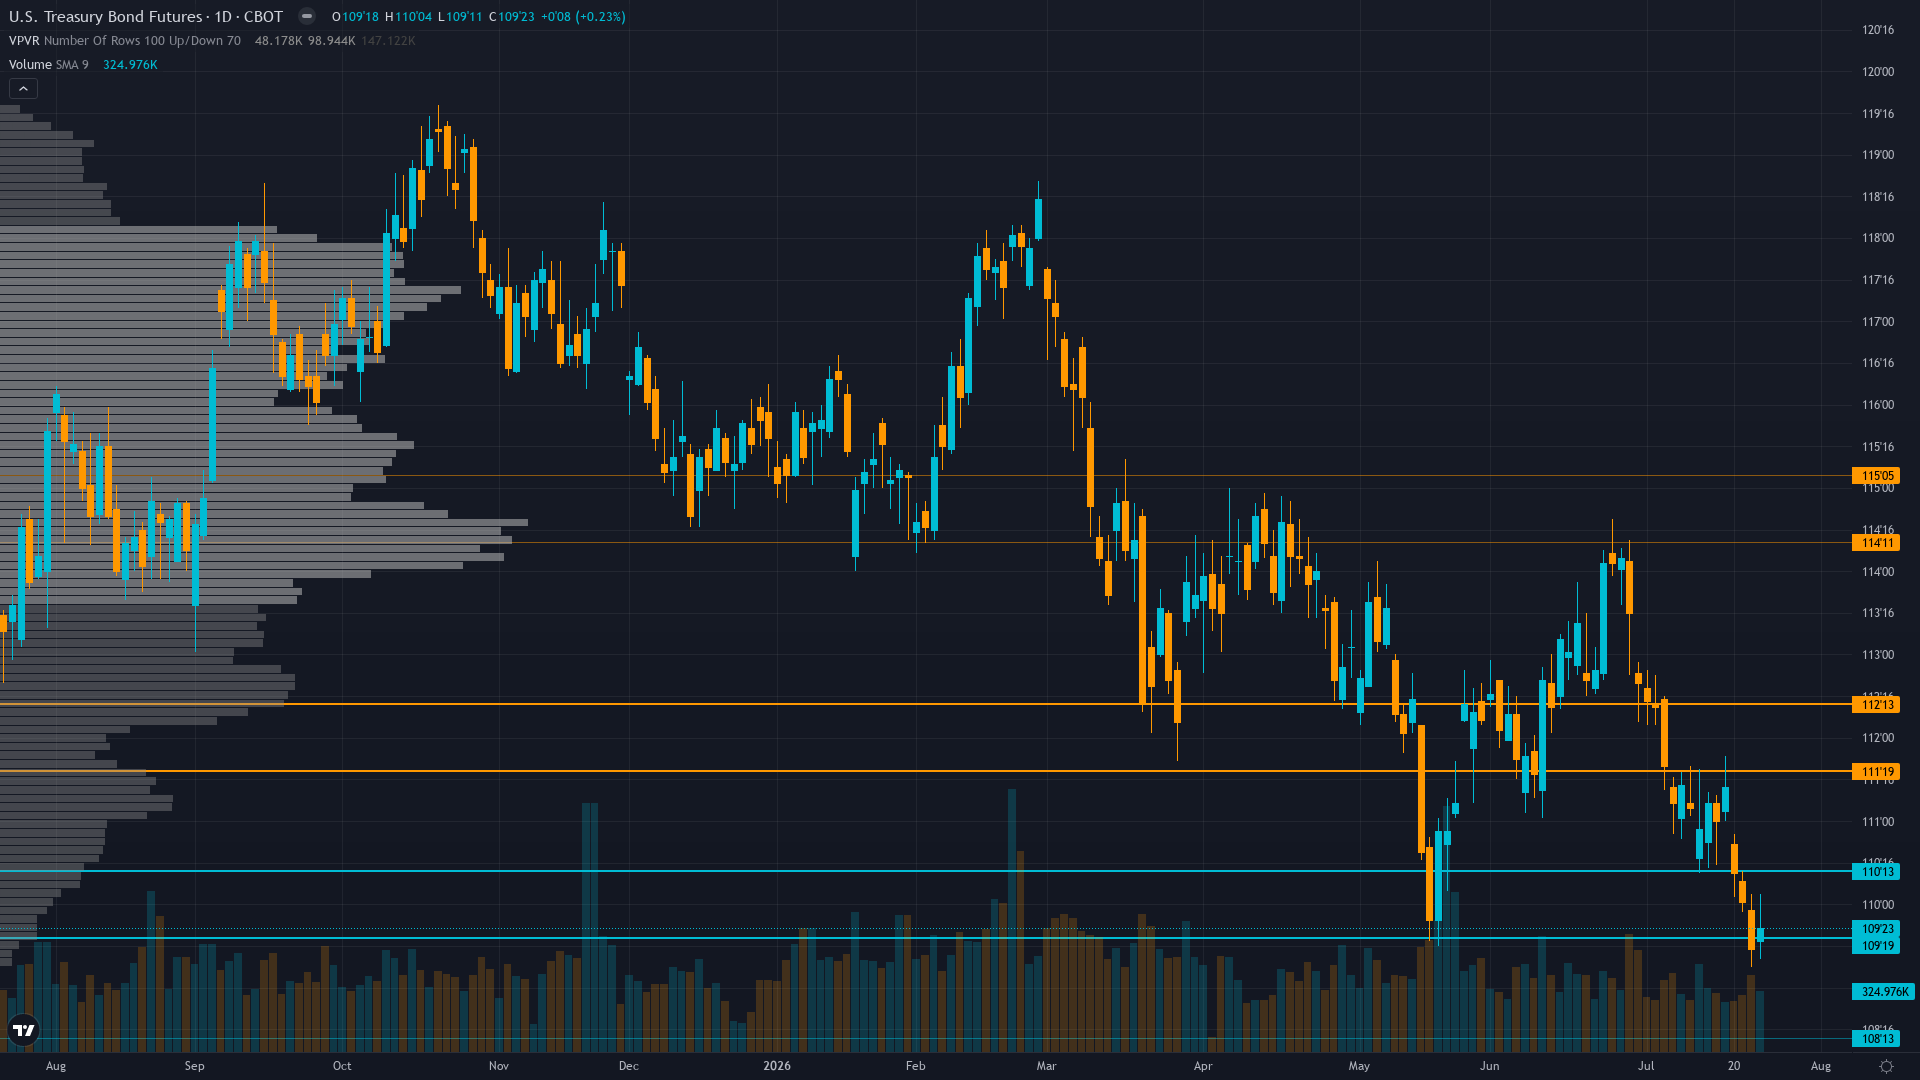
TRANSITIONAL WITH BEARISH UNDERTONE - VIX AT 16.64 WELL BELOW 20 SIGNALS CONTAINED EQUITY VOLATILITY WITH RISK-ON UNDERTONE PER SENTIMENT DATA, YET BONDS SOLD OFF LAST WEEK UNABLE TO RALLY ON JUNE CPI DOVISH SURPRISE CREATING SAFE-HAVEN PARADOX AS FED MAINTAINS 3.50-3.75% WITH JULY 28-29 FOMC 3 DAYS AWAY (POLYMARKET SHOWS 75% NO-CHANGE, 25% HIKE) REPRESENTING BINARY CATALYST THAT CREATES MAXIMUM POLICY UNCERTAINTY WITHOUT CLEAR DIRECTIONAL DOMINANCE IN CURRENT VOID; REGIME CHARACTERIZED BY PROFOUND DISCONNECT BETWEEN DOVISH JUNE CPI DATA AND MARKET'S INABILITY TO PRICE DURATION RALLY SUGGESTING EITHER SKEPTICISM ABOUT FED PIVOT OR STRUCTURAL SUPPLY PRESSURE DOMINATING
Smart Money Positioning
30-year Treasury holds at 109.53, off 0.79% in a modest retracement from recent levels.
Unable to access current COT data per Institutional Agent limiting visibility; open interest declining to 1.84M per TradingView suggests participant deleveraging validating washed-out positioning though auction demand remains adequate without extremes
Sentiment & Positioning
Sentiment around Treasury bond futures is neutral, with no extreme positioning on either side. This balanced state often resolves when a catalyst breaks the equilibrium.
Options Market Signal
MOVE at 80 up 16.94% weekly from 68 compressed regime represents sharp volatility expansion signaling rising term premium and uncertainty ahead of July 28-29 FOMC; ZB IV at 8.20% remains extremely depressed with IV Percentile 0.8 suggesting market underpricing volatility expansion risk despite MOVE spike creating dangerous regime transition setup
Where We Agree & Diverge
Market consensus: Market pricing 75% hold probability at July 28-29 FOMC maintaining 3.50-3.75% range with 25% hike probability per Polymarket $91.9M volume; bonds consolidating 109-111 range awaiting FOMC clarity on whether June CPI 3.5% dovish surprise shifts forward guidance from June 17 hawkish dot plot with structural deficit supply pressure widely recognized
Primary driver: Last week BULLISH call MISSED with -0.79% decline from 110.625 to 109.75 extending consecutive miss streak to 2 (one away from mandatory reset threshold) while FOMC binary catalyst 3 days forward (July 28-29) creates noise-threshold environment where probable weekly move 0.4-0.5% sits BELOW 0.50% Noise Floor with no fresh information beyond widely-priced dynamics forcing NEUTRAL per Rules 1 and 2
Net Assessment
The institutional landscape for T-bond futures shows fear sentiment. Trend strength sits at 4/10, reflecting moderate directional pressure without clear dominance. The combination of positioning data, sentiment, and options flow provides context for understanding where smart money is leaning heading into the week.
Consensus vs Reality
Last Week's Consensus
“Market pricing Fed on hold at July 28-29 FOMC with 95% probability maintaining 3.50-3.75% range per Polymarket; bonds consolidating 110-112 awaiting FOMC clarity on whether June 14 CPI -0.4% dovish surprise shifts forward guidance from June 17 hawkish dot plot with 9 members projecting 2026 hikes”
▼
What Actually Happened
-0.99%
110.625 → 109.53
Common Questions
Where is 30-Year Treasury heading this week?
Market pricing 75% hold probability at July 28-29 FOMC maintaining 3.50-3.75% range with 25% hike probability per Polymarket $91.9M volume; bonds consolidating 109-111 range awaiting FOMC clarity on whether June CPI 3.5% dovish surprise shifts forward guidance from June 17 hawkish dot plot with structural deficit supply pressure widely recognized
What catalysts are affecting 30-Year Treasury price action?
Last week BULLISH call MISSED with -0.79% decline from 110.625 to 109.75 extending consecutive miss streak to 2 (one away from mandatory reset threshold) while FOMC binary catalyst 3 days forward (July 28-29) creates noise-threshold environment where probable weekly move 0.4-0.5% sits BELOW 0.50% Noise Floor with no fresh information beyond widely-priced dynamics forcing NEUTRAL per Rules 1 and 2
How volatile is 30-Year Treasury right now?
Current 30-Year Treasury volatility sits at the 35th percentile of its 90-day range. The regime is normal with a expanding trend across timeframes (5d: 11.2%, 20d: 12.8%, 60d: 14.3%).
What does historical seasonal data show for 30-Year Treasury?
30-Year Treasury enters July 2026 with a neutral seasonal tendency (50% win rate historically). .
What does institutional positioning show for 30-Year Treasury?
Unable to access current COT data per Institutional Agent limiting visibility; open interest declining to 1.84M per TradingView suggests participant deleveraging validating washed-out positioning though auction demand remains adequate without extremes
Want the Full 30-Year Treasury Intelligence Briefing?
This analysis covers one dimension. Our full weekly report combines six specialist agents into a single actionable briefing with directional bias, key levels, and risk-opportunity matrix.