30-Year Treasury COT & Institutional Positioning — Smart Money Analysis
30-Year Treasury institutional positioning: COT data, sentiment analysis and smart money flow assessment.

Institutional Positioning
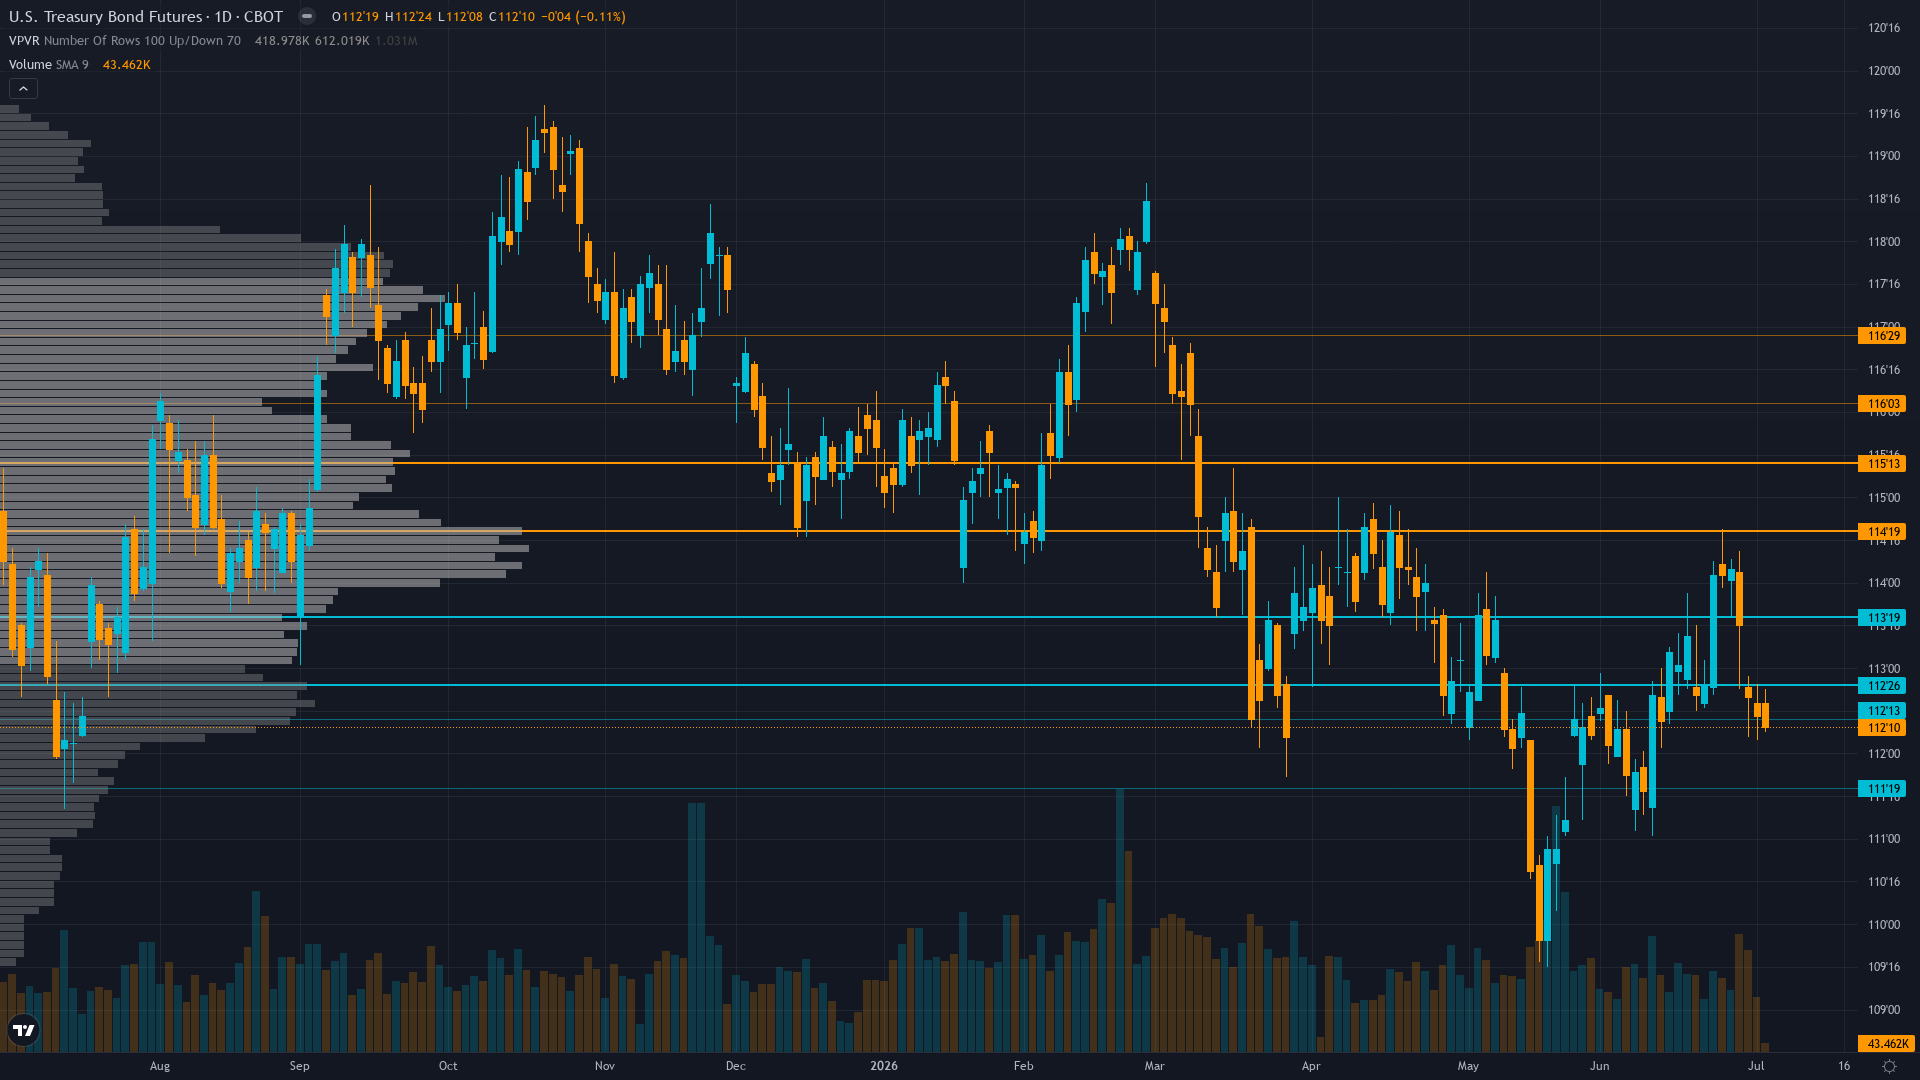
30-year Treasury is trading at 112.2, down 1.51% as selling pressure weighs on price.
Quarter-end rebalancing flows completed June 30 removing mechanical bid; COT data shows net positioning changes yet full breakdown incomplete; Fed shifting QT reinvestment to T-bills removes structural bid from long duration maintaining supply pressure
Where We Agree & Diverge
Market consensus: Market pricing Fed on hold at July 28-29 FOMC maintaining 3.50-3.75% range with higher-for-longer stance through Q3-Q4 2026 per Intellectia.AI analysis; bonds consolidating 110-115 awaiting next catalyst with June 17 Warsh hawkish pivot widely recognized
Primary driver: Last week BEARISH call CORRECT with -1.51% decline from 114.03 to 112.20 validating June 17 Warsh hawkish repricing thesis yet consecutive miss streak now at zero while current bias streak reaches 3 consecutive BEARISH weeks approaching 5-week review threshold requiring heightened thesis justification
Consensus Gaps
Desk bearish lean aligns with market structural bearish positioning from June 17 Warsh hawkish pivot and recent -1.51% weekly decline; directional divergence minimal as consensus broadly defensive matches desk assessment with higher-for-longer pricing widely recognized; conviction proportional to uncertainty with 23-day catalyst void until July FOMC limiting edge beyond widely-priced structural dynamics creating low MAD score appropriate for aligned-consensus environment
Sentiment Analysis
Positioning in Treasury bond futures is balanced, with neither bulls nor bears holding a decisive edge. Neutral sentiment typically precedes a directional catalyst.
Derivatives Intelligence
MOVE at 65.40 collapsed 5.31% weekly and 10.82% monthly from elevated levels to extreme compression near multi-year lows signaling dangerous complacency; ZB IV at 8.20% extremely depressed with IV Rank 1.2 near 52-week lows creating vulnerability to volatility mean reversion yet current calm supports range-bound assessment until catalyst emerges
Net Assessment
The institutional landscape for T-bond futures shows fear sentiment. Trend strength sits at 4/10, reflecting moderate directional pressure without clear dominance. The combination of positioning data, sentiment, and options flow provides context for understanding where smart money is leaning heading into the week.
This analysis covers one dimension. Our full weekly report combines six specialist agents into a single actionable briefing with directional bias, key levels, and risk-opportunity matrix.
Start Free — Get the Market of the WeekFree weekly report · No credit card · Upgrade anytime



