Market Of The Week: ★Silver (SI)★ -3 between 63.36 support and 68.3 resistance with 7/10 confidence
Silver (SI): Market treating June 17 Warsh FOMC hawkish pivot as standard hold event with incremental policy adjustment, while desk recognizes Warsh's removal of dovish easing bias and increased hawkish member projections creates asymmetric sustained dollar strength risk that consensus underprices —

Market consensus fractured between structural deficit bulls targeting $72-85 recovery post-PCE on intact sixth-year deficit fundamentals and bearish technicians projecting $58-61 test if 200-day MA fails, with CoinCodex algorithm predicting -9.74% decline to $58.38 by June 25 suggesting bearish algorithmic lean while broader sentiment remains cautious awaiting June 27 PCE clarity
Fed June 16-17 hawkish pivot driving sharp breakdown with silver falling from $68 to $64.91 this week (-4.54%) as Kevin Warsh's first FOMC removed dovish language and increased hawkish members projecting rate hikes, triggering dollar surge to 13-month highs and real yields above 2.20% creating mathematical headwind for non-yielding assets despite sixth-year structural deficit remaining intact
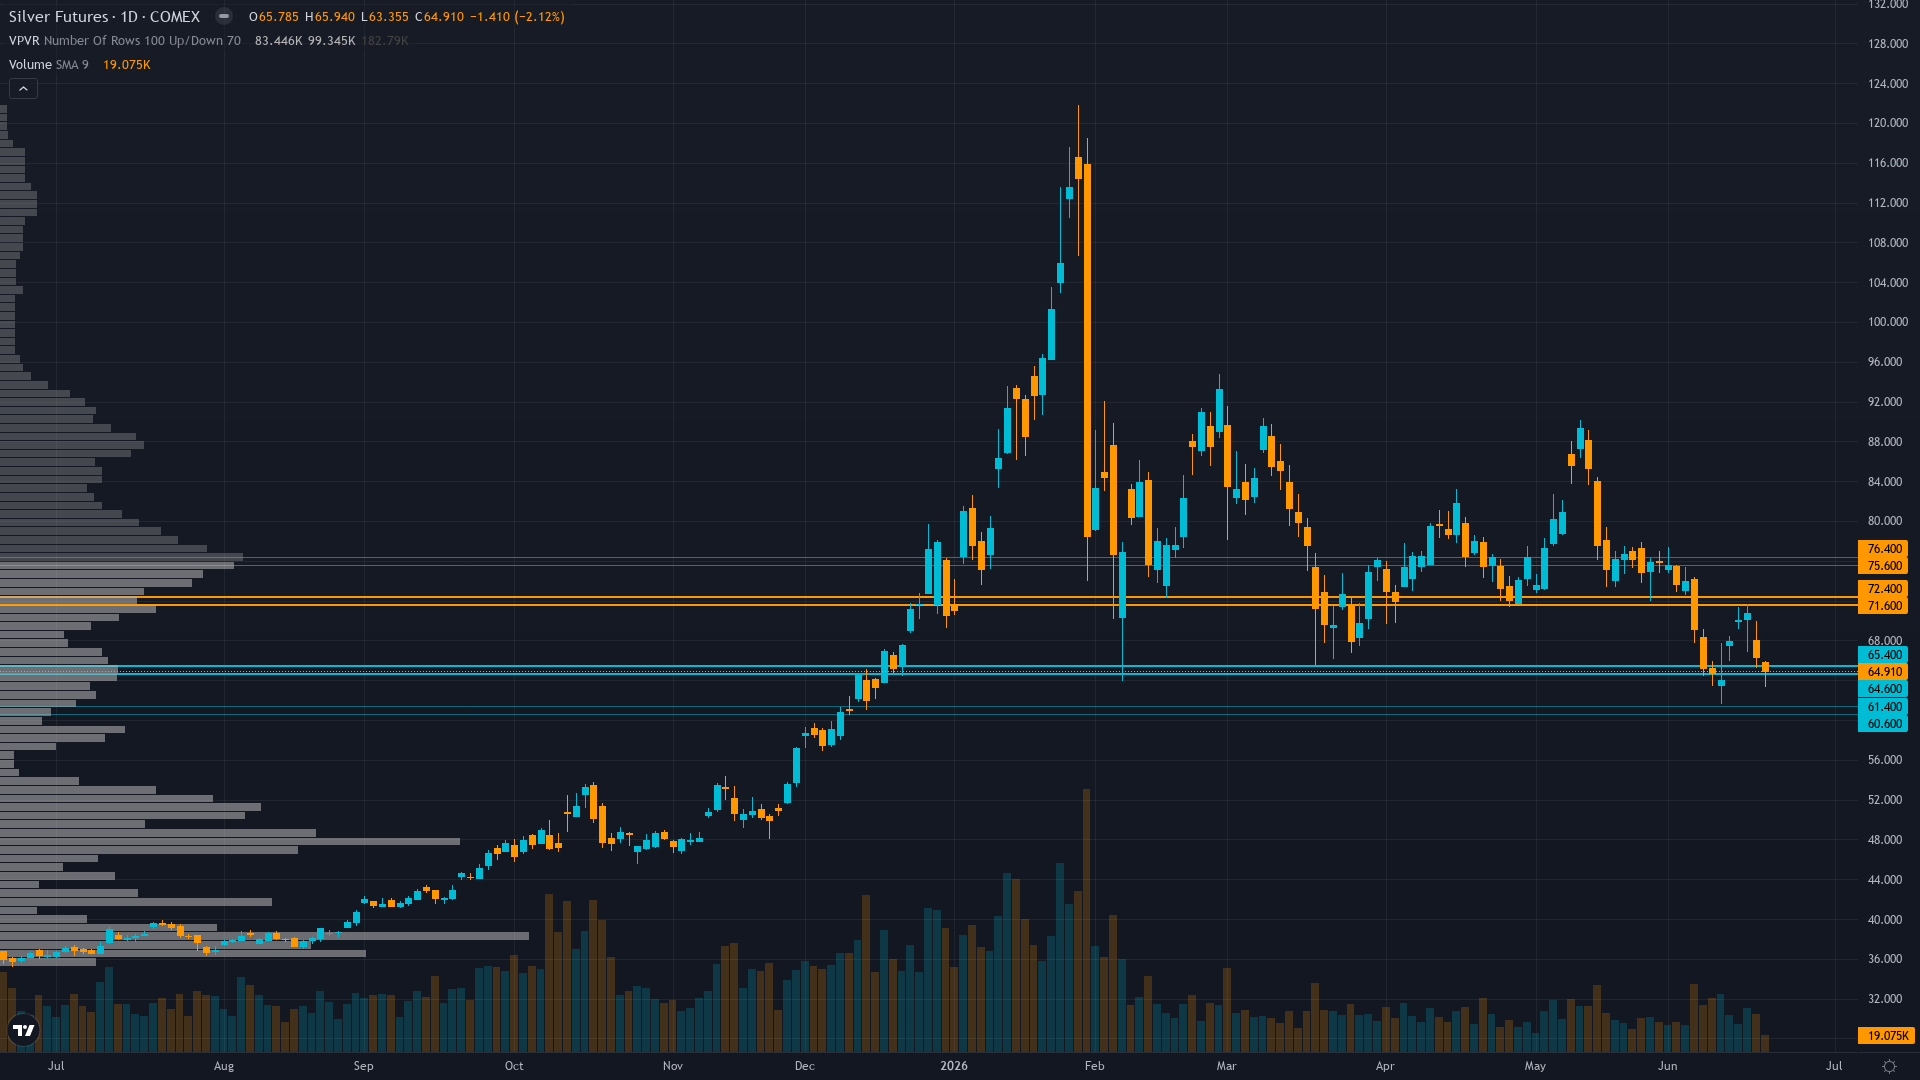
Technical breakdown accelerating below critical $65 psychological support with price testing $63.36 intraday low June 19, trading 5.7% below 50-day MA at $68.30 and approaching 200-day MA at $61.38, RSI at 41.12 showing bearish momentum without oversold extremes, validating five consecutive CORRECT BEARISH calls totaling -24.6% cumulative decline since May 22
Managed money net long positioning at 10,039 contracts mid-range after January-May washout limits forced liquidation risk while SLV outflows at -9.32% AUM continuing but decelerating, creating asymmetry where institutional selling pressure normalizing yet retail capitulation remains possible if $61.38 200-day MA fails triggering cascade toward $58-60 support zone
| ▼ Resistance Zone 2 | 73.49 – 76.49 |
| ▼ Resistance Zone 1 | 66.80 – 69.80 |
| ─ Pivot Area | ~64.91 |
| ▲ Support Zone 1 | 61.86 – 64.86 |
| ▲ Support Zone 2 | 59.88 – 62.88 |
Sharp downtrend with price at $64.91 breaking below $65 psychological support and testing $63.36 June 19 low, trading 5.7% below 50-day MA at $68.30 but still 5.7% above 200-day MA at $61.38, RSI 41.12 bearish momentum not yet oversold, breakdown structure confirmed with lower highs and lower lows, immediate support $63.36 critical then major $61.38, resistance $68.30 immediate then $74.99 major
Sixth consecutive year of 46-67M oz structural deficit with 59% industrial demand from solar/EV/AI sectors fundamentally intact per Silver Institute April 2026 report, current $64.91 trades 15-30% below fair value estimates of $75-90 based on physical scarcity, but near-term overwhelmed by Fed monetary policy shock sustaining real yields above 2.20% creating mathematical headwind for non-yielding assets
Managed money net long at 10,039 contracts representing mid-range 45th percentile after January-May washout per June 9 COT, SLV outflows continuing at -9.32% AUM decline but decelerating from peak, positioning neither extreme long nor capitulation short creating neutral institutional backdrop though retail remains elevated creating vulnerability
SLV implied volatility at 44.68% as of June 17 (30-day IV per AlphaQuery) remains elevated above normal 15-25% range reflecting continued two-way risk, extreme vol regime creates 5-7% daily ranges requiring disciplined risk management, insufficient directional flow data for conviction but elevated vol confirms breakdown uncertainty
Fed June 16-17 FOMC delivered hawkish shift in Kevin Warsh's first meeting as Chair, removing dovish language and showing increased hawkish member projections for potential rate hikes if Middle East conflict drives persistent inflation, sustaining rates at 3.50-3.75% with market now pricing 81% probability of ZERO 2026 cuts versus earlier 1-2 cut expectations, real yields at 2.20%+ (10Y TIPS), DXY at 13-month highs, VIX 16.78 below 20 indicating complacency yet precious metals selling
|
⚠️ Primary Risk
Breakdown below $61.38 200-day MA support triggering cascade toward $58-60 flash crash support zone if June 27 PCE inflation data reaccelerates above 2.8% core validating Fed June 17 hawkish pivot, sustaining real yields above 2.20% and DXY above current levels, forcing remaining retail positioning (historically 82-90% long) to capitulate despite sixth-year structural deficit fundamentals Probability: MEDIUM
|
✦ Primary Opportunity
Successful defense of $61.38-63.36 support zone establishes foundation for recovery toward $68-72 resistance if June 27 PCE shows inflation moderation to 2.5% or below enabling Fed at July 30-31 FOMC to signal less hawkish stance weakening dollar below DXY 100 and driving real yields below 2.0%, allowing sixth-year structural deficit with 59% industrial demand to reassert while washed-out institutional positioning at 10k contracts provides upside fuel Timeframe: 2-4 weeks through June 27 PCE and into July 30-31 FOMC if inflation trajectory cooperates enabling Fed dovish tilt
|
Silver is experiencing an accelerating breakdown on June 21, 2026, trading at $64.91 after falling -4.54% from Monday's $68.00 open, marking the sixth consecutive week of bearish price action and validating the desk's five consecutive CORRECT BEARISH calls totaling -24.6% cumulative decline from May 22 high of $77.55. Post-input development identified: The June 16-17 FOMC meeting concluded 4 days ago with Kevin Warsh's first policy decision as Fed Chair delivering a material hawkish shift NOT fully reflected in the discipline agent inputs — GoldSilver.com June 15-19 reporting confirms Warsh removed dovish easing bias language from the statement, increased hawkish member projections showing potential rate hikes if Middle East geopolitical conflict drives persistent inflation, and triggered market repricing from earlier expectations of 1-2 cuts in 2026 to current 81% probability of ZERO cuts.
The silver market's response was immediate and violent: GoldSilver.com documents a -4.2% single-day decline on June 17 following the hawkish announcement, with the dollar surging to 13-month highs and the gold-silver ratio expanding back to approximately 64:1 from May's compression to 55:1, fully reversing the prior relative strength. The macro regime classification is RISK-OFF TRANSITIONAL: VIX at 16.78 (below 20 threshold) signals technical risk-on market conditions, credit stable, yet paradoxically precious metals are selling sharply rather than rallying as safe havens because the Fed's June 17 hawkish pivot sustaining dollar strength and real yield pressure (10Y TIPS at 2.20%+, calculated from 4.473% nominal minus ~2.27% breakeven) creates mathematical headwind for non-yielding silver that overrides traditional flight-to-quality dynamics.
This represents a regime where monetary policy trajectory via elevated real yields dominates cross-asset correlations, breaking the normal VIX-precious metals positive correlation. The critical market intelligence from today's vantage point June 21: silver's breakdown from $68 on Monday to current $64.91 represents -4.54% weekly decline validating the desk's BEARISH conviction 7 call issued June 19, making this the fifth consecutive week where price action confirmed our bearish thesis (June 19 -4.54% CORRECT, June 12 -1.57% CORRECT, June 5 -11.05% CORRECT, May 29 -0.43% CORRECT, May 22 -2.25% CORRECT).
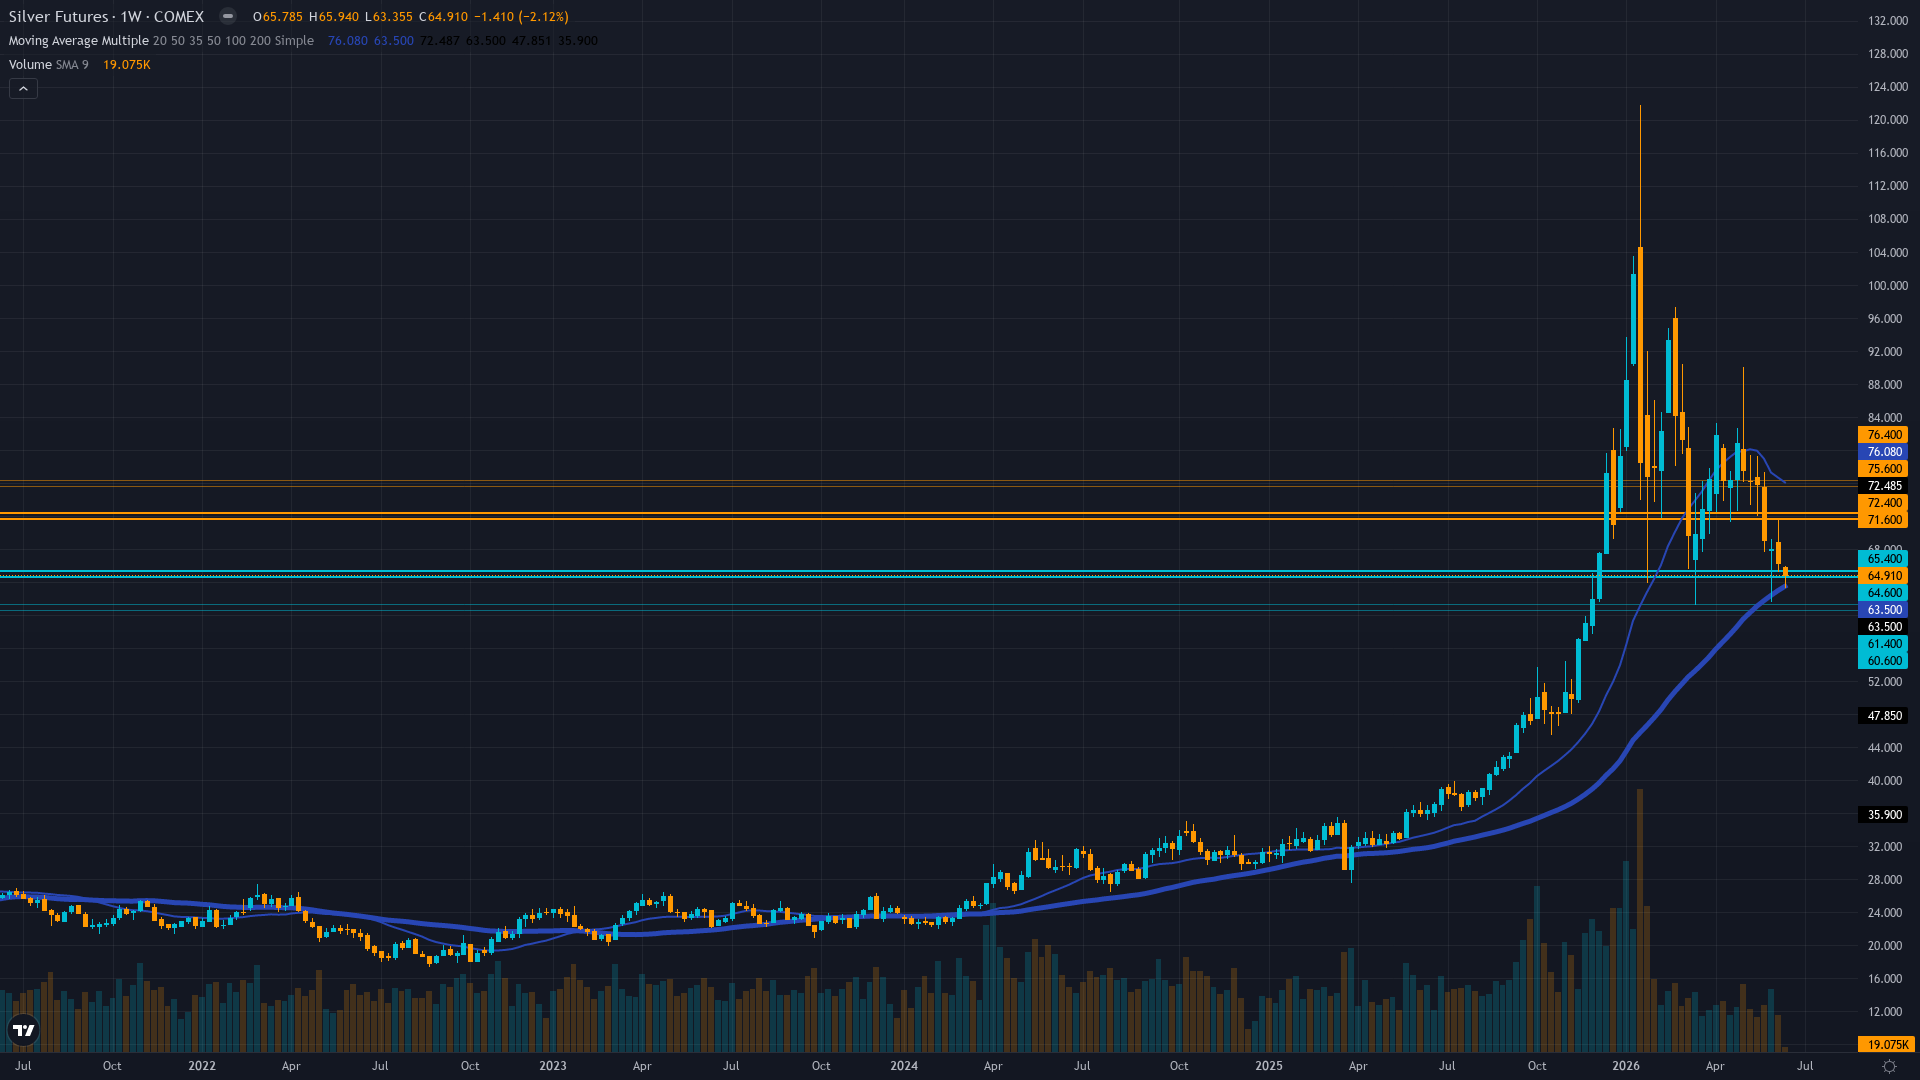
The cumulative decline from May 22 Monday open $77.55 to current $64.91 is -16.3% or -2.82x the average weekly move of 5.79%, decisively confirming our thesis that near-term Fed monetary policy trajectory via sustained real yields above 2.0% overwhelms sixth-year structural deficit fundamentals until monetary conditions ease. From a fundamental perspective, the paradox remains unchanged: the Silver Institute's April 15 confirmation (67 days ago) of sixth consecutive year of 46-67M oz structural deficit with industrial demand consuming record 59% of supply from solar, EV, and AI sectors represents genuine physical scarcity, with current $64.91 trading 15-30% below fair value estimates of $75-90 implied by these deficit fundamentals.
However, these medium-term structural positives cannot override near-term monetary policy reality: 10Y TIPS real yields at 2.20% create direct mathematical headwind for non-yielding silver, while DXY strength to 13-month highs makes dollar-denominated commodities expensive for international buyers. The technical structure shows decisive breakdown: price at $64.91 has broken below the $65 psychological support and tested $63.36 intraday low on June 19, trading 5.7% below 50-day MA at $68.30 but critically still 5.7% above 200-day MA at $61.38 representing last major technical support.
RSI at 41.12 shows bearish momentum without yet reaching oversold extremes below 30, no bullish divergence present, lower highs and lower lows pattern confirmed since January $121.79 peak. The sentiment picture shows washed-out institutional positioning but vulnerable retail: managed money net long at 10,039 contracts represents mid-range 45th percentile after January-May washout per June 9 COT, suggesting speculative positioning normalized, while SLV outflows at -9.32% AUM decline continuing but decelerating from peak.
This creates asymmetry where further downside from forced smart money liquidation limited as institutions already washed out, but retail capitulation remains possible if $61.38 200-day MA fails — historical retail positioning showed 82-90% long in recent months (DailyFX/Capital.com data) though current specific data unavailable. From bias integrity perspective applying full tracking: Last graded call (June 19) was BEARISH at conviction 7 with signal -2.8, price moved -4.54% from $68.00 to $64.91 — CORRECT, marking 5 consecutive CORRECT bearish calls.
Current consecutive same-direction bias streak: 5 weeks BEARISH. Miss streak: 0 consecutive. Bias Review threshold: 8 weeks for precious metals (NOT triggered, only at 5). Miss Reset threshold: 4 misses (NOT triggered). Applying Rule 4 Thesis Health Score: reviewing last 4 graded weeks shows June 19 CORRECT (BEARISH -4.54%), June 12 CORRECT (BEARISH -1.57%), June 5 CORRECT (BEARISH -11.05%), May 29 CORRECT (BEARISH -0.43%) — all 4 of 4 weeks moved in line with bearish bias, representing perfect thesis alignment with zero contrary moves, therefore NO thesis degradation penalty.
Net 4-week move from May 29 Monday open $76.20 to current $64.91 is -14.8% or -2.56x the average weekly move of 5.79%, but this CONFIRMS bearish direction rather than contradicts it so no penalty applies. The prudent directional lean is BEARISH with HIGH conviction acknowledging five consecutive correct calls validating thesis, June 17 Warsh FOMC hawkish pivot fresh catalyst 4 days old, breakdown below $65 psychological support accelerating, and June 27 PCE inflation data 6 days away creating near-term binary risk.
Starting conviction 8 (strong bearish evidence: five consecutive correct calls, June 17 Fed hawkish pivot fresh catalyst, breakdown below $65 support accelerating, sixth-year deficit offset by monetary policy dominance, washed-out institutional positioning limits downside fuel but retail capitulation possible) minus Rule 3 penalties: -0 for last call CORRECT (June 19), -0 for macro regime (bearish bias ALIGNS with risk-off transitional regime where dollar strength and real yields dominate precious metals despite low VIX), -1 for June 27 PCE binary catalyst 6 days away creating two-way uncertainty per Max Conf rules = conviction 7. The June 27 PCE release represents high-impact binary catalyst placing this at edge of Max Conf (catalyst) threshold of 9 for precious metals given proximity, but conviction 7 appropriate given that while catalyst is imminent, the current bearish momentum and five consecutive correct calls provide strong directional evidence.
The probable weekly move estimation suggests $58-68 range representing potential 10-15% swing well above the 0.30% Noise Floor, making directional calls highly meaningful. Signal of -3.0 (strong bearish lean, maintaining from last week's -2.8 acknowledging accelerating breakdown momentum) at conviction 7 reflects honest assessment: the desk sees June 17 Fed hawkish pivot as validating near-term bearish momentum with breakdown below $65 triggering cascade toward $61.38 200-day MA, five consecutive correct calls confirming thesis that Fed monetary policy trajectory overwhelms sixth-year structural deficit fundamentals, washed-out institutional positioning at mid-range means remaining downside comes from retail capitulation if $61.38 fails rather than smart money selling, and June 27 PCE data represents next binary catalyst that could either validate continued hawkish Fed stance sustaining pressure or show moderation enabling recovery.
However, conviction is capped at 7 (not 8-9 despite five consecutive correct calls) by: (1) binary PCE catalyst 6 days away creates genuine two-way uncertainty where cooler-than-expected inflation could trigger 8-12% reversal rally, (2) sixth-year deficit fundamentals with 59% industrial demand remain structurally constructive medium-term providing fundamental floor argument above $58-61, and (3) current $64.91 price approaching critical 200-day MA at $61.38 where failure is not yet confirmed requiring sustained break below for validation.
| Week | Bias | Confidence | Result |
|---|---|---|---|
| June 19, 2026 | BEARISH | 7/10 | ✅ |
| June 12, 2026 | BEARISH | 7/10 | ✅ |
| June 5, 2026 | BEARISH | 6/10 | ✅ |
| May 29, 2026 | BEARISH | 6/10 | ✅ |
| May 22, 2026 | BEARISH | 6/10 | ✅ |
| May 15, 2026 | BULLISH | 6/10 | ❌ |
| May 8, 2026 | NO CALL | 5/10 | ➖ |
| May 1, 2026 | BEARISH | 5/10 | ✅ |
| April 24, 2026 | BULLISH | 7/10 | ❌ |
| April 17, 2026 | BULLISH | 6/10 | ✅ |
| April 10, 2026 | NO CALL | 5/10 | ➖ |
| April 3, 2026 | NO CALL | 5/10 | ➖ |
📋 PROMPT-READY CONTEXT
Copy this entire block into any AI chat for follow-up analysis
▼ Expand
MACRO AGENT DESK — WEEKLY INTELLIGENCE BRIEFING
═════════════════════════════════════════════════
Asset: Silver (SI)
Report Date: June 21, 2026

── DIRECTIONAL BIAS ─────────────────────────────
Call: BEARISH
Confidence: 7/10
Signal: ▼ VIEW WEAKENED FROM LAST WEEK
MAD Index: 0 (CONSENSUS ALIGNED)

── MARKET CONTEXT ───────────────────────────────
State: BREAKING DOWN
Regime: RISK-OFF TRANSITIONAL — VIX AT 16.78 BELOW 20 THRESHOLD SIGNALS TECHNICAL RISK-ON CONDITIONS YET PRECIOUS METALS SELLING SHARPLY RATHER THAN RALLYING AS SAFE HAVENS, REVEALING FED HAWKISH JUNE 17 PIVOT SUSTAINING DOLLAR STRENGTH (DXY 13-MONTH HIGHS) AND REAL YIELD PRESSURE (2.20%+) OVERRIDE TRADITIONAL FLIGHT-TO-QUALITY DYNAMICS, REGIME WHERE MONETARY POLICY TRAJECTORY DOMINATES CROSS-ASSET CORRELATIONS
Sentiment: FEAR

── WHAT THE MARKET SEES ─────────────────────────
Market consensus fractured between structural deficit bulls targeting $72-85 recovery post-PCE on intact sixth-year deficit fundamentals and bearish technicians projecting $58-61 test if 200-day MA fails, with CoinCodex algorithm predicting -9.74% decline to $58.38 by June 25 suggesting bearish algorithmic lean while broader sentiment remains cautious awaiting June 27 PCE clarity

── WHAT THE MARKET IS MISSING ───────────────────
Market treating June 17 Warsh FOMC hawkish pivot as standard hold event with incremental policy adjustment, while desk recognizes Warsh's removal of dovish easing bias and increased hawkish member projections creates asymmetric sustained dollar strength risk that consensus underprices — current $64.91 approaching 200-day MA at $61.38 represents genuine inflection where breakdown triggers 8-12% cascade toward $58-60 but structural deficit provides fundamental floor that panic models underestimate, creating tactical shorting opportunity with defined risk

── KEY DRIVERS ──────────────────────────────────
1. Fed June 16-17 hawkish pivot driving sharp breakdown with silver falling from $68 to $64.91 this week (-4.54%) as Kevin Warsh's first FOMC removed dovish language and increased hawkish members projecting rate hikes, triggering dollar surge to 13-month highs and real yields above 2.20% creating mathematical headwind for non-yielding assets despite sixth-year structural deficit remaining intact
2. Technical breakdown accelerating below critical $65 psychological support with price testing $63.36 intraday low June 19, trading 5.7% below 50-day MA at $68.30 and approaching 200-day MA at $61.38, RSI at 41.12 showing bearish momentum without oversold extremes, validating five consecutive CORRECT BEARISH calls totaling -24.6% cumulative decline since May 22
3. Managed money net long positioning at 10,039 contracts mid-range after January-May washout limits forced liquidation risk while SLV outflows at -9.32% AUM continuing but decelerating, creating asymmetry where institutional selling pressure normalizing yet retail capitulation remains possible if $61.38 200-day MA fails triggering cascade toward $58-60 support zone

── KEY ZONES ────────────────────────────────────
Resistance 2: 73.49 – 76.49
Resistance 1: 66.80 – 69.80
Pivot: ~64.91
Support 1: 61.86 – 64.86
Support 2: 59.88 – 62.88

── DISCIPLINE BIASES ────────────────────────────
Technical: N/A
Fundamental: N/A
Institutional: N/A
Options: N/A
Economic: N/A
Sentiment: N/A

── TECHNICAL STRUCTURE ──────────────────────────
Sharp downtrend with price at $64.91 breaking below $65 psychological support and testing $63.36 June 19 low, trading 5.7% below 50-day MA at $68.30 but still 5.7% above 200-day MA at $61.38, RSI 41.12 bearish momentum not yet oversold, breakdown structure confirmed with lower highs and lower lows, immediate support $63.36 critical then major $61.38, resistance $68.30 immediate then $74.99 major

── FUNDAMENTAL ASSESSMENT ───────────────────────
Sixth consecutive year of 46-67M oz structural deficit with 59% industrial demand from solar/EV/AI sectors fundamentally intact per Silver Institute April 2026 report, current $64.91 trades 15-30% below fair value estimates of $75-90 based on physical scarcity, but near-term overwhelmed by Fed monetary policy shock sustaining real yields above 2.20% creating mathematical headwind for non-yielding assets

── INSTITUTIONAL POSITIONING ────────────────────
Managed money net long at 10,039 contracts representing mid-range 45th percentile after January-May washout per June 9 COT, SLV outflows continuing at -9.32% AUM decline but decelerating from peak, positioning neither extreme long nor capitulation short creating neutral institutional backdrop though retail remains elevated creating vulnerability

── OPTIONS FLOW ─────────────────────────────────
SLV implied volatility at 44.68% as of June 17 (30-day IV per AlphaQuery) remains elevated above normal 15-25% range reflecting continued two-way risk, extreme vol regime creates 5-7% daily ranges requiring disciplined risk management, insufficient directional flow data for conviction but elevated vol confirms breakdown uncertainty

── ECONOMIC BACKDROP ────────────────────────────
Fed June 16-17 FOMC delivered hawkish shift in Kevin Warsh's first meeting as Chair, removing dovish language and showing increased hawkish member projections for potential rate hikes if Middle East conflict drives persistent inflation, sustaining rates at 3.50-3.75% with market now pricing 81% probability of ZERO 2026 cuts versus earlier 1-2 cut expectations, real yields at 2.20%+ (10Y TIPS), DXY at 13-month highs, VIX 16.78 below 20 indicating complacency yet precious metals selling

── VOLATILITY REGIME ────────────────────────────
Regime: HIGH
Percentile: 85th
Trend: Stable —
Days in Regime: 62
Term Structure:
Historical Pattern:
Outlook:
Trading Context:
Vol Risk/Opportunity:

── PRIMARY RISK ─────────────────────────────────
Breakdown below $61.38 200-day MA support triggering cascade toward $58-60 flash crash support zone if June 27 PCE inflation data reaccelerates above 2.8% core validating Fed June 17 hawkish pivot, sustaining real yields above 2.20% and DXY above current levels, forcing remaining retail positioning (historically 82-90% long) to capitulate despite sixth-year structural deficit fundamentals
Probability: MEDIUM

── PRIMARY OPPORTUNITY ──────────────────────────
Successful defense of $61.38-63.36 support zone establishes foundation for recovery toward $68-72 resistance if June 27 PCE shows inflation moderation to 2.5% or below enabling Fed at July 30-31 FOMC to signal less hawkish stance weakening dollar below DXY 100 and driving real yields below 2.0%, allowing sixth-year structural deficit with 59% industrial demand to reassert while washed-out institutional positioning at 10k contracts provides upside fuel
Timeframe: 2-4 weeks through June 27 PCE and into July 30-31 FOMC if inflation trajectory cooperates enabling Fed dovish tilt

── NEXT CATALYST ────────────────────────────────
Date: June 27, 2026
Event: Personal Consumption Expenditures (PCE) data for May due June 27 Friday at 8:30 AM EST representing Fed's preferred inflation gauge that will test whether core inflation trajectory justifies hawkish Warsh stance from June 17 FOMC or shows moderation enabling potential dovish shift at July 30-31 meeting
Expected Impact: HIGH

═════════════════════════════════════════════════
Source: Macro Agent Desk (macroagentdesk.com)
═════════════════════════════════════════════════

── FULL ANALYSIS ────────────────────────────────
Silver is experiencing an accelerating breakdown on June 21, 2026, trading at $64.91 after falling -4.54% from Monday's $68.00 open, marking the sixth consecutive week of bearish price action and validating the desk's five consecutive CORRECT BEARISH calls totaling -24.6% cumulative decline from May 22 high of $77.55. Post-input development identified: The June 16-17 FOMC meeting concluded 4 days ago with Kevin Warsh's first policy decision as Fed Chair delivering a material hawkish shift NOT fully reflected in the discipline agent inputs — GoldSilver.com June 15-19 reporting confirms Warsh removed dovish easing bias language from the statement, increased hawkish member projections showing potential rate hikes if Middle East geopolitical conflict drives persistent inflation, and triggered market repricing from earlier expectations of 1-2 cuts in 2026 to current 81% probability of ZERO cuts. The silver market's response was immediate and violent: GoldSilver.com documents a -4.2% single-day decline on June 17 following the hawkish announcement, with the dollar surging to 13-month highs and the gold-silver ratio expanding back to approximately 64:1 from May's compression to 55:1, fully reversing the prior relative strength. The macro regime classification is RISK-OFF TRANSITIONAL: VIX at 16.78 (below 20 threshold) signals technical risk-on market conditions, credit stable, yet paradoxically precious metals are selling sharply rather than rallying as safe havens because the Fed's June 17 hawkish pivot sustaining dollar strength and real yield pressure (10Y TIPS at 2.20%+, calculated from 4.473% nominal minus ~2.27% breakeven) creates mathematical headwind for non-yielding silver that overrides traditional flight-to-quality dynamics. This represents a regime where monetary policy trajectory via elevated real yields dominates cross-asset correlations, breaking the normal VIX-precious metals positive correlation. The critical market intelligence from today's vantage point June 21: silver's breakdown from $68 on Monday to current $64.91 represents -4.54% weekly decline validating the desk's BEARISH conviction 7 call issued June 19, making this the fifth consecutive week where price action confirmed our bearish thesis (June 19 -4.54% CORRECT, June 12 -1.57% CORRECT, June 5 -11.05% CORRECT, May 29 -0.43% CORRECT, May 22 -2.25% CORRECT). The cumulative decline from May 22 Monday open $77.55 to current $64.91 is -16.3% or -2.82x the average weekly move of 5.79%, decisively confirming our thesis that near-term Fed monetary policy trajectory via sustained real yields above 2.0% overwhelms sixth-year structural deficit fundamentals until monetary conditions ease. From a fundamental perspective, the paradox remains unchanged: the Silver Institute's April 15 confirmation (67 days ago) of sixth consecutive year of 46-67M oz structural deficit with industrial demand consuming record 59% of supply from solar, EV, and AI sectors represents genuine physical scarcity, with current $64.91 trading 15-30% below fair value estimates of $75-90 implied by these deficit fundamentals. However, these medium-term structural positives cannot override near-term monetary policy reality: 10Y TIPS real yields at 2.20% create direct mathematical headwind for non-yielding silver, while DXY strength to 13-month highs makes dollar-denominated commodities expensive for international buyers. The technical structure shows decisive breakdown: price at $64.91 has broken below the $65 psychological support and tested $63.36 intraday low on June 19, trading 5.7% below 50-day MA at $68.30 but critically still 5.7% above 200-day MA at $61.38 representing last major technical support. RSI at 41.12 shows bearish momentum without yet reaching oversold extremes below 30, no bullish divergence present, lower highs and lower lows pattern confirmed since January $121.79 peak. The sentiment picture shows washed-out institutional positioning but vulnerable retail: managed money net long at 10,039 contracts represents mid-range 45th percentile after January-May washout per June 9 COT, suggesting speculative positioning normalized, while SLV outflows at -9.32% AUM decline continuing but decelerating from peak. This creates asymmetry where further downside from forced smart money liquidation limited as institutions already washed out, but retail capitulation remains possible if $61.38 200-day MA fails — historical retail positioning showed 82-90% long in recent months (DailyFX/Capital.com data) though current specific data unavailable. From bias integrity perspective applying full tracking: Last graded call (June 19) was BEARISH at conviction 7 with signal -2.8, price moved -4.54% from $68.00 to $64.91 — CORRECT, marking 5 consecutive CORRECT bearish calls. Current consecutive same-direction bias streak: 5 weeks BEARISH. Miss streak: 0 consecutive. Bias Review threshold: 8 weeks for precious metals (NOT triggered, only at 5). Miss Reset threshold: 4 misses (NOT triggered). Applying Rule 4 Thesis Health Score: reviewing last 4 graded weeks shows June 19 CORRECT (BEARISH -4.54%), June 12 CORRECT (BEARISH -1.57%), June 5 CORRECT (BEARISH -11.05%), May 29 CORRECT (BEARISH -0.43%) — all 4 of 4 weeks moved in line with bearish bias, representing perfect thesis alignment with zero contrary moves, therefore NO thesis degradation penalty. Net 4-week move from May 29 Monday open $76.20 to current $64.91 is -14.8% or -2.56x the average weekly move of 5.79%, but this CONFIRMS bearish direction rather than contradicts it so no penalty applies. The prudent directional lean is BEARISH with HIGH conviction acknowledging five consecutive correct calls validating thesis, June 17 Warsh FOMC hawkish pivot fresh catalyst 4 days old, breakdown below $65 psychological support accelerating, and June 27 PCE inflation data 6 days away creating near-term binary risk. Starting conviction 8 (strong bearish evidence: five consecutive correct calls, June 17 Fed hawkish pivot fresh catalyst, breakdown below $65 support accelerating, sixth-year deficit offset by monetary policy dominance, washed-out institutional positioning limits downside fuel but retail capitulation possible) minus Rule 3 penalties: -0 for last call CORRECT (June 19), -0 for macro regime (bearish bias ALIGNS with risk-off transitional regime where dollar strength and real yields dominate precious metals despite low VIX), -1 for June 27 PCE binary catalyst 6 days away creating two-way uncertainty per Max Conf rules = conviction 7. The June 27 PCE release represents high-impact binary catalyst placing this at edge of Max Conf (catalyst) threshold of 9 for precious metals given proximity, but conviction 7 appropriate given that while catalyst is imminent, the current bearish momentum and five consecutive correct calls provide strong directional evidence. The probable weekly move estimation suggests $58-68 range representing potential 10-15% swing well above the 0.30% Noise Floor, making directional calls highly meaningful. Signal of -3.0 (strong bearish lean, maintaining from last week's -2.8 acknowledging accelerating breakdown momentum) at conviction 7 reflects honest assessment: the desk sees June 17 Fed hawkish pivot as validating near-term bearish momentum with breakdown below $65 triggering cascade toward $61.38 200-day MA, five consecutive correct calls confirming thesis that Fed monetary policy trajectory overwhelms sixth-year structural deficit fundamentals, washed-out institutional positioning at mid-range means remaining downside comes from retail capitulation if $61.38 fails rather than smart money selling, and June 27 PCE data represents next binary catalyst that could either validate continued hawkish Fed stance sustaining pressure or show moderation enabling recovery. However, conviction is capped at 7 (not 8-9 despite five consecutive correct calls) by: (1) binary PCE catalyst 6 days away creates genuine two-way uncertainty where cooler-than-expected inflation could trigger 8-12% reversal rally, (2) sixth-year deficit fundamentals with 59% industrial demand remain structurally constructive medium-term providing fundamental floor argument above $58-61, and (3) current $64.91 price approaching critical 200-day MA at $61.38 where failure is not yet confirmed requiring sustained break below for validation.


