Market Of The Week: ★Gold (GC)★ Market may be underestimating depth of central bank demand deterioration…
Gold (GC): Market may be underestimating depth of central bank demand deterioration (January 5t versus 27t average) while overweighting geopolitical safe-haven narrative that failed to support gold during March 19 6% intraday crash; desk recognizes breakdown is real but timing of BEARISH call after

Mixed to bearish with institutional targets being rapidly revised lower following worst weekly decline since 1983 and FOMC hawkish surprise creating near-term directional uncertainty
Historic selloff accelerating with gold suffering worst weekly decline since 1983 following March 18-19 FOMC hawkish hold reducing 2026 rate cut expectations from two cuts to just one while Middle East war drives oil-induced inflation fears
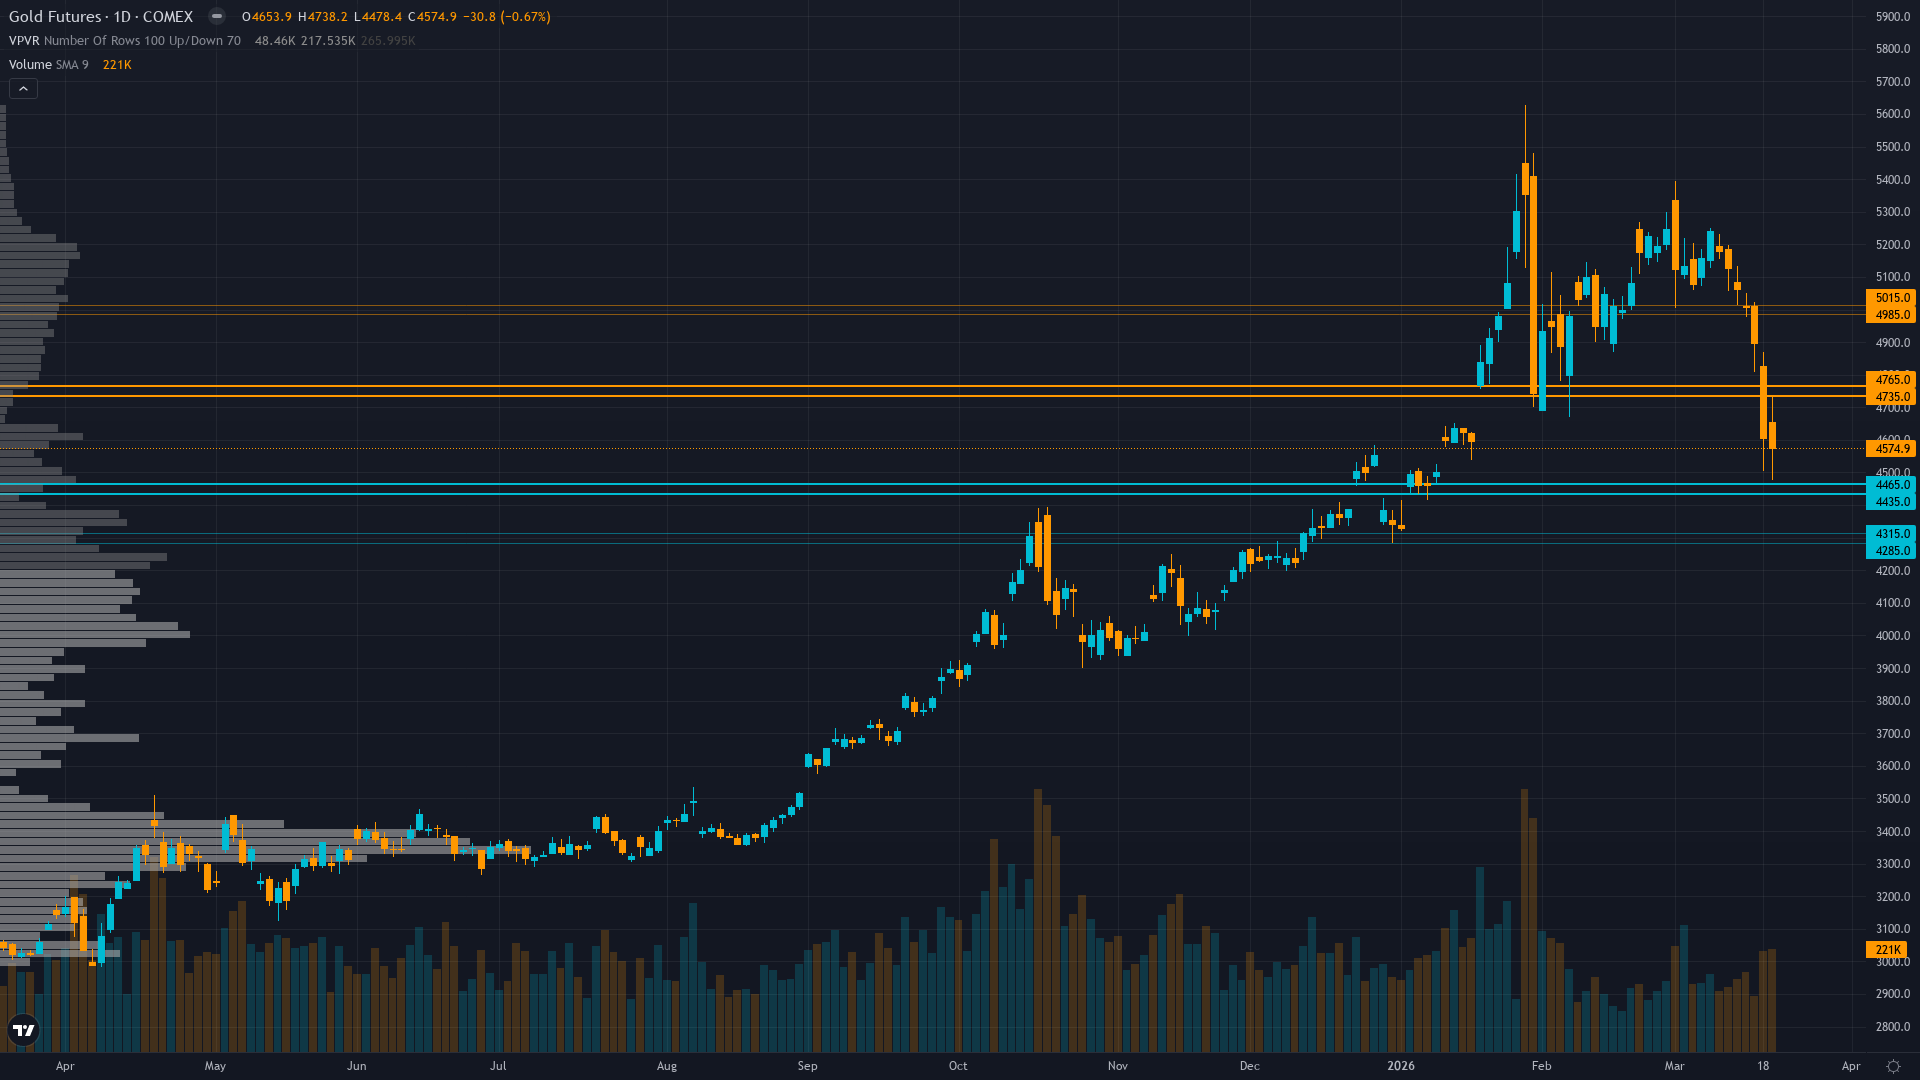
Technical structure collapsed with price breaking decisively below $5000 paradigm support and $4900 50-day MA now trading at $4575 down 20% from January $5626 all-time high in sustained liquidation cascade
Dollar surging back above DXY 100 from oversold 97 levels reversing key inverse correlation tailwind while real yields rising on reduced Fed easing expectations creating dual headwind for non-yielding gold
| ▼ Resistance Zone 2 | 4975 – 5025 |
| ▼ Resistance Zone 1 | 4725 – 4775 |
| ─ Pivot Area | ~4575 |
| ▲ Support Zone 1 | 4425 – 4475 |
| ▲ Support Zone 2 | 4275 – 4325 |
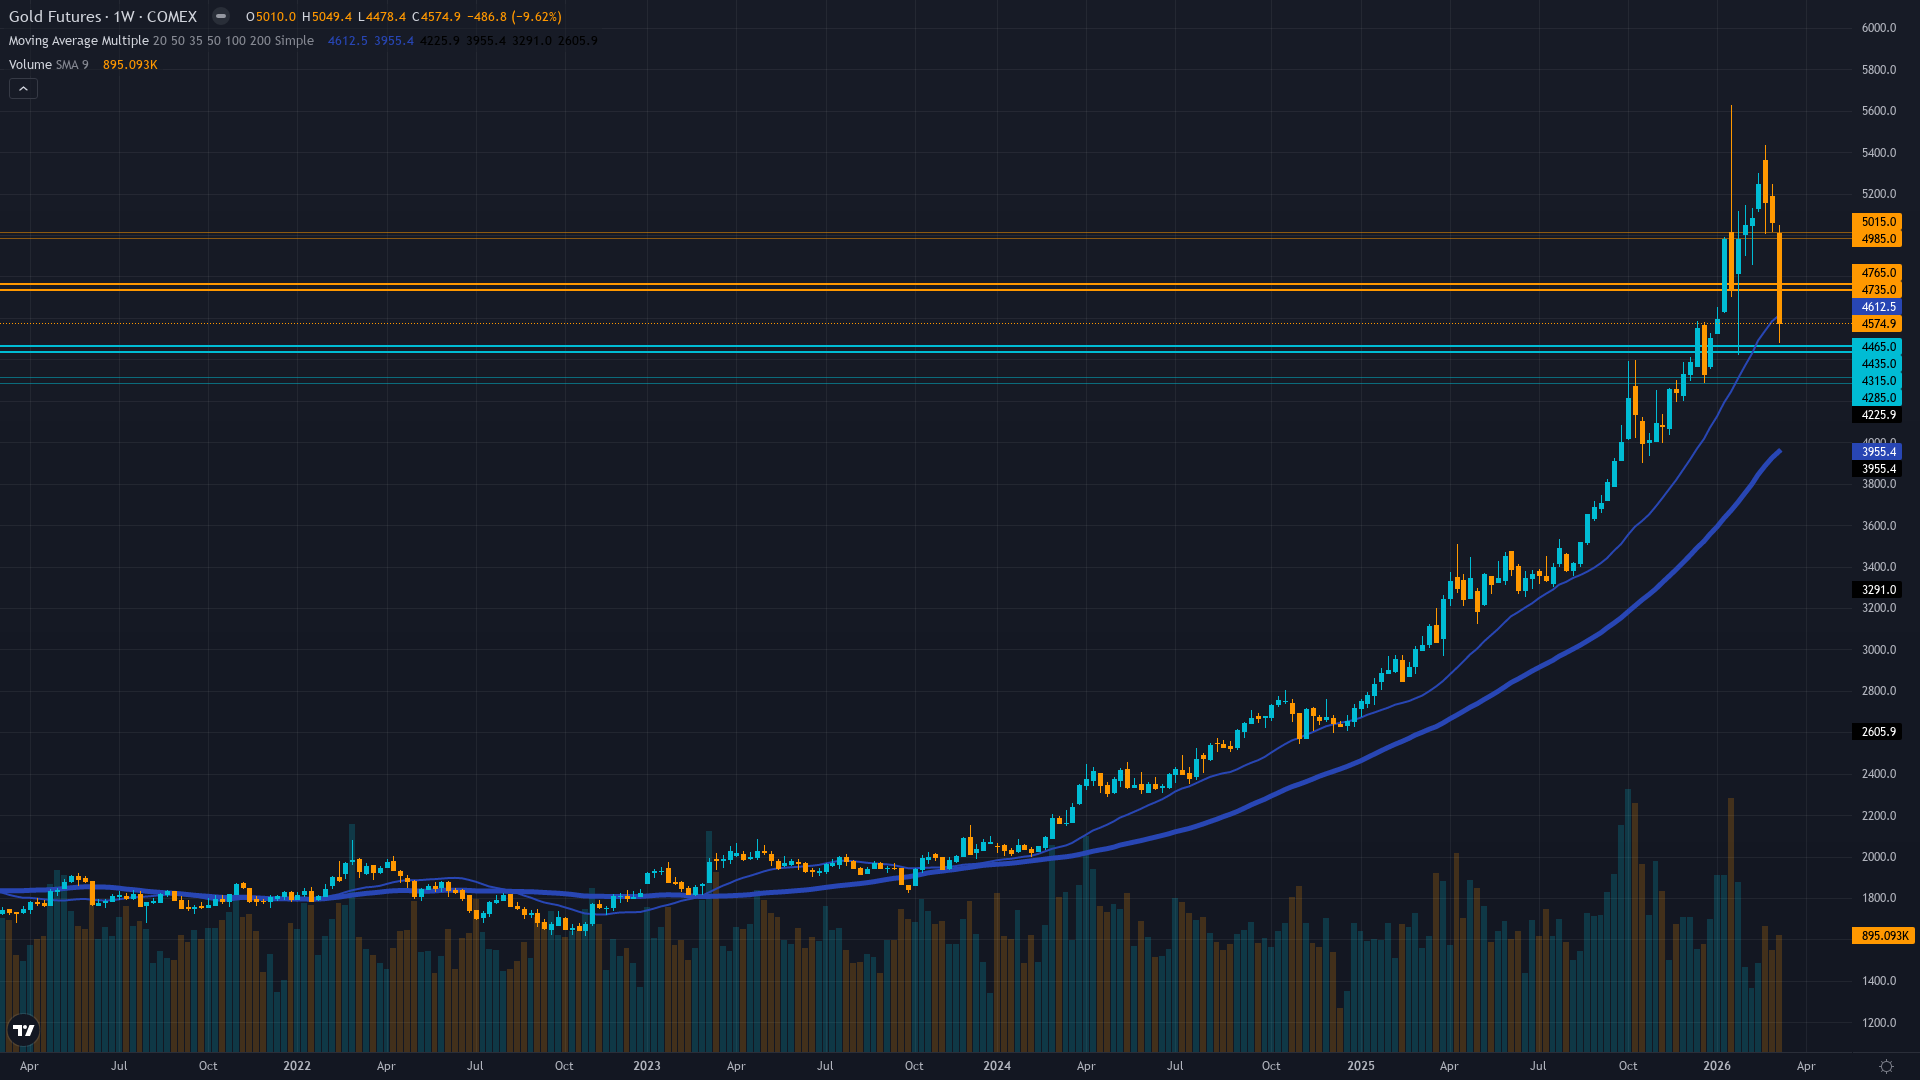
Major breakdown complete with price at $4575 having violated $5000 psychological support and 50-day MA with next major support at $4450 February lows then $4300 200-day MA zone as downtrend accelerates
Hawkish Fed recalibration at March 18-19 FOMC reduced dot plot to one 2026 cut from two combined with oil-driven inflation reacceleration creates hostile environment for gold despite structural central bank demand thesis deteriorating
Managed money net long ~93k contracts being liquidated in forced selling cascade while central bank demand collapse to 5t in January versus 27t monthly average removes structural bid floor creating institutional exodus
GVZ volatility at 31.23 elevated but declining from January 48.68 spike indicating fear premium compression while options market shows no clear directional bias reflecting uncertainty in post-breakdown environment
Fed delivered hawkish hold March 18-19 with dot plot revision to one 2026 cut creating higher-for-longer rate trajectory while Middle East war pushing oil prices higher threatens inflation reacceleration undermining easing case
Inverted - short-term 28.5% elevated above longer-term 24.2% indicating acute stress from March FOMC hawkish surprise and historic selloff creating elevated near-term uncertainty
Post-major breakdown below psychological levels volatility remains elevated 3-4 weeks then resolves directionally; 75% of similar $500+ breakdown episodes continue lower within 30 days during Fed hawkish pivots historically
High volatility regime day 12 typically lasts 10-20 days suggesting potential further elevated conditions through end of March as market digests FOMC implications with 60% probability of normalization by early April
Elevated volatility at 88th percentile requires wider stops with daily ranges potentially 3-6% versus normal 2-3%; current breakdown from $5000 suggests continued large moves likely until new equilibrium established around $4300-4500 zone
Current high volatility environment at $4575 with historical vol at 88th percentile suggests asymmetric risk skewed to downside with 6-8% further decline toward $4300 200-day MA possible versus 3-4% bounce resistance at $4750-4900; volatility spike reflects genuine structural repricing rather than temporary panic creating unfavorable risk-reward for counter-trend positioning
|
⚠️ Primary Risk
Continued dollar strength above DXY 100 combined with rising real yields if March CPI prints hot again would validate Fed hawkish stance and drive gold toward $4300 200-day MA representing additional 6% downside from current levels Probability: HIGH
|
✦ Primary Opportunity
Iran conflict escalation or financial stability shock triggers safe-haven panic buying overriding monetary policy dynamics and reversing current liquidation cascade back toward $5000 resistance Timeframe: Next 2-4 weeks dependent on geopolitical developments or Fed communication shifts before April 10 CPI release
|
MACRO REGIME CLASSIFICATION: RISK-OFF TRANSITIONING. VIX elevated at 26.78 as of March 21 (above 25 threshold signaling heightened stress), credit conditions tightening, and gold experiencing historic liquidation despite traditional safe-haven status creates DIVERGENT regime where equities face fear but gold paradoxically selling off due to monetary policy recalibration overriding haven demand. Post-input development identified: Gold suffered its worst week since 1983 per Bloomberg March 19 report, with spot gold falling 6% intraday March 19 to $4500 marking six-week low in dramatic reversal from January $5626 all-time high.
The March 18-19 FOMC meeting delivered a materially hawkish surprise with the dot plot revised DOWN to just one 2026 rate cut from two cuts projected in December, and seven of 19 FOMC participants now expecting ZERO cuts. This represents a fundamental shift in the forward policy path occurring just 3-4 days ago that is NOT fully reflected in the discipline agent inputs which were compiled before this catalyst. Powell's conditional forward guidance emphasized inflation persistence: 'If we don't see that progress, then you won't see the rate cut.' Treasury yields ROSE after the decision despite no rate change, indicating market repricing toward higher-for-longer.
The combination of reduced easing expectations (raising real yields and opportunity cost of holding gold) plus Middle East war driving oil prices higher (threatening inflation reacceleration that would further delay Fed cuts) creates a uniquely hostile macro backdrop. Current price at $4574.90 represents catastrophic 20% decline from January peak and decisive violation of the $5000 psychological level that was supposed to represent permanent paradigm support. This is not consolidation—this is breakdown.
The desk issued NO CALL last week at $5061 which was followed by an 11.26% collapse, the largest weekly move in gold's modern history. The technical damage is severe: 50-day MA breached, daily trend decisively DOWN, and price making lower lows with no apparent stabilization. However, issuing BEARISH now after the move has already occurred presents significant timing risk—classic late-to-the-trade positioning. The fundamental case deteriorated materially: January central bank buying collapsed 81% to just 5 tonnes versus 27t monthly average removing the permanent bid floor thesis, dollar rebounded sharply to DXY 100+ reversing the inverse correlation tailwind, and the Fed's hawkish recalibration pushes real yields higher creating valuation pressure.
Precious metals typically trend persistently and require two consecutive contrary weeks before flipping bias per Section 3 guidance—we now have exactly that with three consecutive weeks moving against the prior BULLISH bias. Conviction reduced from prior levels due to: (1) timing risk of calling BEARISH after 20% decline already occurred, (2) two consecutive MISSED calls degrading thesis credibility requiring -2 penalty per Rule 3, (3) geopolitical wildcard from Iran war that could reverse sentiment instantly.
The path forward likely sees continued pressure toward $4450 (February low) and potentially $4300 (200-day MA) unless geopolitical escalation or Fed communication pivot provides catalyst for reversal.
| Week | Bias | Confidence | Result |
|---|---|---|---|
| March 20, 2026 | NO CALL | 5/10 | ➖ |
| March 14, 2026 | BULLISH | 6/10 | ❌ |
| March 6, 2026 | BULLISH | 8/10 | ❌ |
| February 27, 2026 | BULLISH | 8/10 | ✅ |
| February 21, 2026 | BULLISH | 8/10 | ✅ |
| February 13, 2026 | BULLISH | 8/10 | ❌ |
| February 8, 2026 | BULLISH | 8/10 | ✅ |
| February 1, 2026 | BULLISH | 8/10 | ✅ |
| January 25, 2026 | BULLISH | 8/10 | ❌ |
| January 11, 2026 | BULLISH | 8/10 | ✅ |
| January 4, 2026 | BULLISH | 8/10 | ✅ |
| December 28, 2025 | BULLISH | 9/10 | ❌ |
📋 PROMPT-READY CONTEXT
Copy this entire block into any AI chat for follow-up analysis
▼ Expand
MACRO AGENT DESK — WEEKLY INTELLIGENCE BRIEFING
═════════════════════════════════════════════════
Asset: Gold (GC)
Report Date: March 22, 2026

── DIRECTIONAL BIAS ─────────────────────────────
Call: BEARISH
Confidence: 6/10
Signal: ▼ VIEW WEAKENED FROM LAST WEEK
MAD Index: 35 (SLIGHT DIVERGENCE)

── MARKET CONTEXT ───────────────────────────────
State: BREAKING DOWN
Regime: BREAKDOWN
Sentiment: EXTREME FEAR

── WHAT THE MARKET SEES ─────────────────────────
Mixed to bearish with institutional targets being rapidly revised lower following worst weekly decline since 1983 and FOMC hawkish surprise creating near-term directional uncertainty

── WHAT THE MARKET IS MISSING ───────────────────
Market may be underestimating depth of central bank demand deterioration (January 5t versus 27t average) while overweighting geopolitical safe-haven narrative that failed to support gold during March 19 6% intraday crash; desk recognizes breakdown is real but timing of BEARISH call after 20% decline creates unfavorable entry risk-reward

── KEY DRIVERS ──────────────────────────────────
1. Historic selloff accelerating with gold suffering worst weekly decline since 1983 following March 18-19 FOMC hawkish hold reducing 2026 rate cut expectations from two cuts to just one while Middle East war drives oil-induced inflation fears
2. Technical structure collapsed with price breaking decisively below $5000 paradigm support and $4900 50-day MA now trading at $4575 down 20% from January $5626 all-time high in sustained liquidation cascade
3. Dollar surging back above DXY 100 from oversold 97 levels reversing key inverse correlation tailwind while real yields rising on reduced Fed easing expectations creating dual headwind for non-yielding gold

── KEY ZONES ────────────────────────────────────
Resistance 2: 4975 – 5025
Resistance 1: 4725 – 4775
Pivot: ~4575
Support 1: 4425 – 4475
Support 2: 4275 – 4325

── DISCIPLINE BIASES ────────────────────────────
Technical: BEARISH
Fundamental: BEARISH
Institutional: BEARISH
Options: NO CALL
Economic: BEARISH
Sentiment: BEARISH

── TECHNICAL STRUCTURE ──────────────────────────
Major breakdown complete with price at $4575 having violated $5000 psychological support and 50-day MA with next major support at $4450 February lows then $4300 200-day MA zone as downtrend accelerates

── FUNDAMENTAL ASSESSMENT ───────────────────────
Hawkish Fed recalibration at March 18-19 FOMC reduced dot plot to one 2026 cut from two combined with oil-driven inflation reacceleration creates hostile environment for gold despite structural central bank demand thesis deteriorating

── INSTITUTIONAL POSITIONING ────────────────────
Managed money net long ~93k contracts being liquidated in forced selling cascade while central bank demand collapse to 5t in January versus 27t monthly average removes structural bid floor creating institutional exodus

── OPTIONS FLOW ─────────────────────────────────
GVZ volatility at 31.23 elevated but declining from January 48.68 spike indicating fear premium compression while options market shows no clear directional bias reflecting uncertainty in post-breakdown environment

── ECONOMIC BACKDROP ────────────────────────────
Fed delivered hawkish hold March 18-19 with dot plot revision to one 2026 cut creating higher-for-longer rate trajectory while Middle East war pushing oil prices higher threatens inflation reacceleration undermining easing case

── VOLATILITY REGIME ────────────────────────────
Regime: HIGH
Percentile: 88th
Trend: Expanding ▲
Days in Regime: 12
Term Structure: inverted - short-term 28.5% elevated above longer-term 24.2% indicating acute stress from March FOMC hawkish surprise and historic selloff creating elevated near-term uncertainty
Historical Pattern: Post-major breakdown below psychological levels volatility remains elevated 3-4 weeks then resolves directionally; 75% of similar $500+ breakdown episodes continue lower within 30 days during Fed hawkish pivots historically
Outlook: High volatility regime day 12 typically lasts 10-20 days suggesting potential further elevated conditions through end of March as market digests FOMC implications with 60% probability of normalization by early April
Trading Context: Elevated volatility at 88th percentile requires wider stops with daily ranges potentially 3-6% versus normal 2-3%; current breakdown from $5000 suggests continued large moves likely until new equilibrium established around $4300-4500 zone
Vol Risk/Opportunity: Current high volatility environment at $4575 with historical vol at 88th percentile suggests asymmetric risk skewed to downside with 6-8% further decline toward $4300 200-day MA possible versus 3-4% bounce resistance at $4750-4900; volatility spike reflects genuine structural repricing rather than temporary panic creating unfavorable risk-reward for counter-trend positioning

── PRIMARY RISK ─────────────────────────────────
Continued dollar strength above DXY 100 combined with rising real yields if March CPI prints hot again would validate Fed hawkish stance and drive gold toward $4300 200-day MA representing additional 6% downside from current levels
Probability: HIGH

── PRIMARY OPPORTUNITY ──────────────────────────
Iran conflict escalation or financial stability shock triggers safe-haven panic buying overriding monetary policy dynamics and reversing current liquidation cascade back toward $5000 resistance
Timeframe: Next 2-4 weeks dependent on geopolitical developments or Fed communication shifts before April 10 CPI release

── NEXT CATALYST ────────────────────────────────
Date: April 10, 2026
Event: March 2026 CPI release critical test of inflation reacceleration thesis following February +0.3% MoM print that preceded Fed hawkish shift
Expected Impact: HIGH

═════════════════════════════════════════════════
Source: Macro Agent Desk (macroagentdesk.com)
═════════════════════════════════════════════════

── FULL ANALYSIS ────────────────────────────────
MACRO REGIME CLASSIFICATION: RISK-OFF TRANSITIONING. VIX elevated at 26.78 as of March 21 (above 25 threshold signaling heightened stress), credit conditions tightening, and gold experiencing historic liquidation despite traditional safe-haven status creates DIVERGENT regime where equities face fear but gold paradoxically selling off due to monetary policy recalibration overriding haven demand. Post-input development identified: Gold suffered its worst week since 1983 per Bloomberg March 19 report, with spot gold falling 6% intraday March 19 to $4500 marking six-week low in dramatic reversal from January $5626 all-time high. The March 18-19 FOMC meeting delivered a materially hawkish surprise with the dot plot revised DOWN to just one 2026 rate cut from two cuts projected in December, and seven of 19 FOMC participants now expecting ZERO cuts. This represents a fundamental shift in the forward policy path occurring just 3-4 days ago that is NOT fully reflected in the discipline agent inputs which were compiled before this catalyst. Powell's conditional forward guidance emphasized inflation persistence: 'If we don't see that progress, then you won't see the rate cut.' Treasury yields ROSE after the decision despite no rate change, indicating market repricing toward higher-for-longer. The combination of reduced easing expectations (raising real yields and opportunity cost of holding gold) plus Middle East war driving oil prices higher (threatening inflation reacceleration that would further delay Fed cuts) creates a uniquely hostile macro backdrop. Current price at $4574.90 represents catastrophic 20% decline from January peak and decisive violation of the $5000 psychological level that was supposed to represent permanent paradigm support. This is not consolidation—this is breakdown. The desk issued NO CALL last week at $5061 which was followed by an 11.26% collapse, the largest weekly move in gold's modern history. The technical damage is severe: 50-day MA breached, daily trend decisively DOWN, and price making lower lows with no apparent stabilization. However, issuing BEARISH now after the move has already occurred presents significant timing risk—classic late-to-the-trade positioning. The fundamental case deteriorated materially: January central bank buying collapsed 81% to just 5 tonnes versus 27t monthly average removing the permanent bid floor thesis, dollar rebounded sharply to DXY 100+ reversing the inverse correlation tailwind, and the Fed's hawkish recalibration pushes real yields higher creating valuation pressure. Precious metals typically trend persistently and require two consecutive contrary weeks before flipping bias per Section 3 guidance—we now have exactly that with three consecutive weeks moving against the prior BULLISH bias. Conviction reduced from prior levels due to: (1) timing risk of calling BEARISH after 20% decline already occurred, (2) two consecutive MISSED calls degrading thesis credibility requiring -2 penalty per Rule 3, (3) geopolitical wildcard from Iran war that could reverse sentiment instantly. The path forward likely sees continued pressure toward $4450 (February low) and potentially $4300 (200-day MA) unless geopolitical escalation or Fed communication pivot provides catalyst for reversal.