Wheat Key Levels This Week — Support, Resistance & Confluence Zones
Wheat key levels breakdown: support zones, resistance zones, confluence and price structure.

Current Price Structure
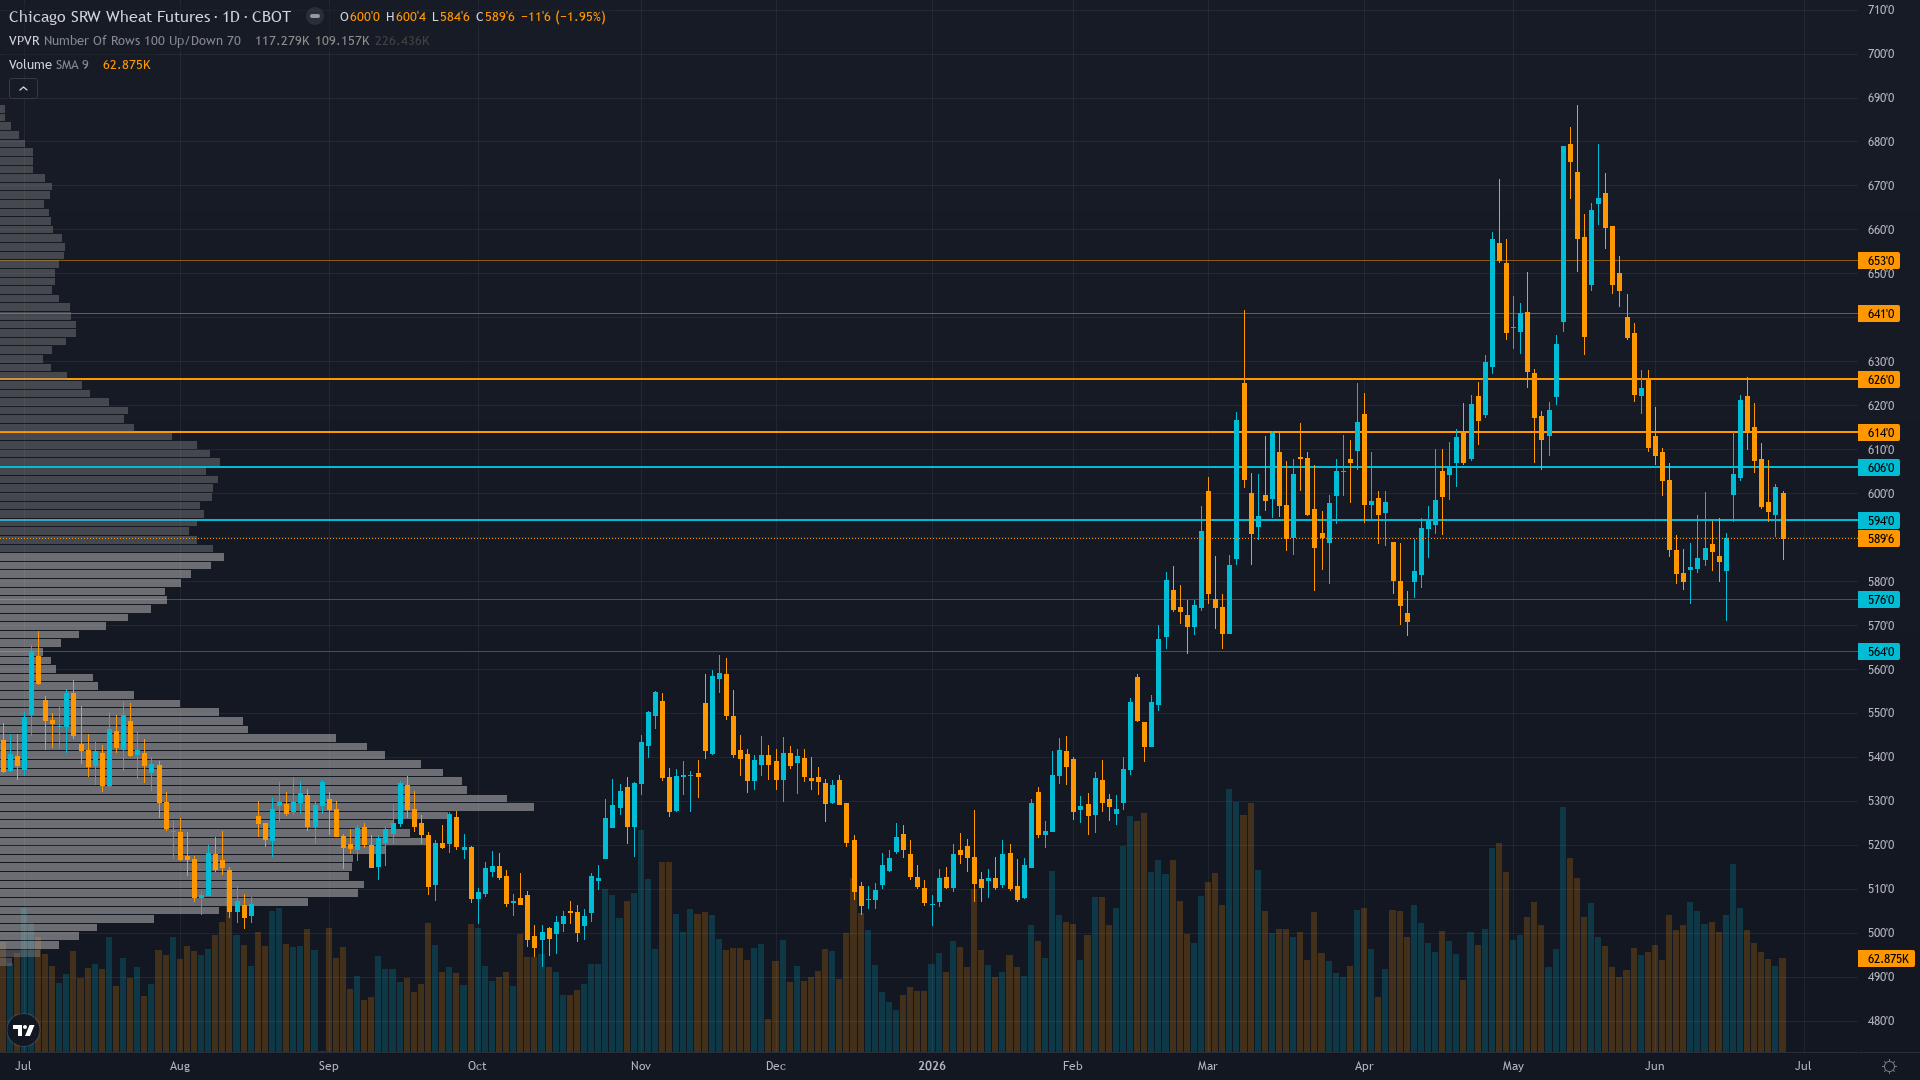
wheat sits at 588.75, having shed 1.87% as bears maintain the upper hand. wheat futures is in a breaking down market state, requiring careful assessment of current conditions.
Confirmed downtrend with price at 588.75 well below 50-day MA (~610) and 200-day MA (~605) after breaking 600 psychological support and 590 immediate support, RSI oversold 35-40 range without clear bullish divergence, testing major support at 585-590 zone with next downside target at 570 June 15 two-month low
With trend strength at only 3/10, any directional bias is thin and easily disrupted.
Support Zone Context
Below the current level, CBOT wheat has structural support where demand has historically stepped in. The reliability of these zones depends on the volume profile and the number of prior interactions.
In the current TRANSITIONAL macro regime with VIX at 16.41 (neutral zone below 20 threshold) indicating calm equity markets, USD at 101.37 DXY showing strength creating export competitiveness headwind for U.S. wheat versus Black Sea suppliers, crude oil elevated yet declining easing input costs, creating mixed cross-currents where improving risk appetite clashes with commodity-specific supply-demand fundamentals allowing agricultural drivers to dominate directional dynamics environment, support zones carry heightened risk of aggressive tests.
Ceilings & Supply Zones
Above current price, wheat futures faces resistance zones where selling pressure has historically intensified. These levels represent previous supply zones, profit-taking areas, or structural barriers that price needs to overcome for continuation.
How firmly these zones hold depends on the confluence of volume, prior reactions, and the current market regime.
Where Disciplines Converge
For CBOT wheat, the levels that matter most are those confirmed by independent analytical approaches. When six different disciplines identify the same zone, the signal-to-noise ratio improves dramatically.
Daily ranges expanded from prior 15-20 cents to current 18-26 cent action following June 11 WASDE breakdown and subsequent testing of 585-590 support requiring wider stops - sustained move below 585 psychological support or recovery above 600 would trigger accelerated directional moves given failed rally structure from May highs and elevated volatility environment with July 10 WASDE 12 days away representing next major binary catalyst for potential 3-5% move in either direction
How Macro Agent Desk Identifies Key Levels
Macro Agent Desk identifies key levels through a six-agent process. Each analytical discipline contributes independently — technical for structure, institutional for smart money interest, options for hedging activity, fundamentals for fair value context, sentiment for crowd positioning, and economics for catalyst timing.
What this means in practice: every key level in the full weekly report has been stress-tested across multiple independent analytical frameworks before it reaches the page.
Our paid reports include specific support and resistance levels identified by six specialist agents — technical structure, institutional positioning, options flow, fundamentals, sentiment, and economic analysis. Not just lines on a chart, but zones validated by multi-discipline confluence.
Start Free — Get the Market of the WeekFree weekly report · No credit card · Upgrade anytime