Wheat Key Levels This Week — Support, Resistance & Confluence Zones
Wheat key levels breakdown: support zones, resistance zones, confluence and price structure.

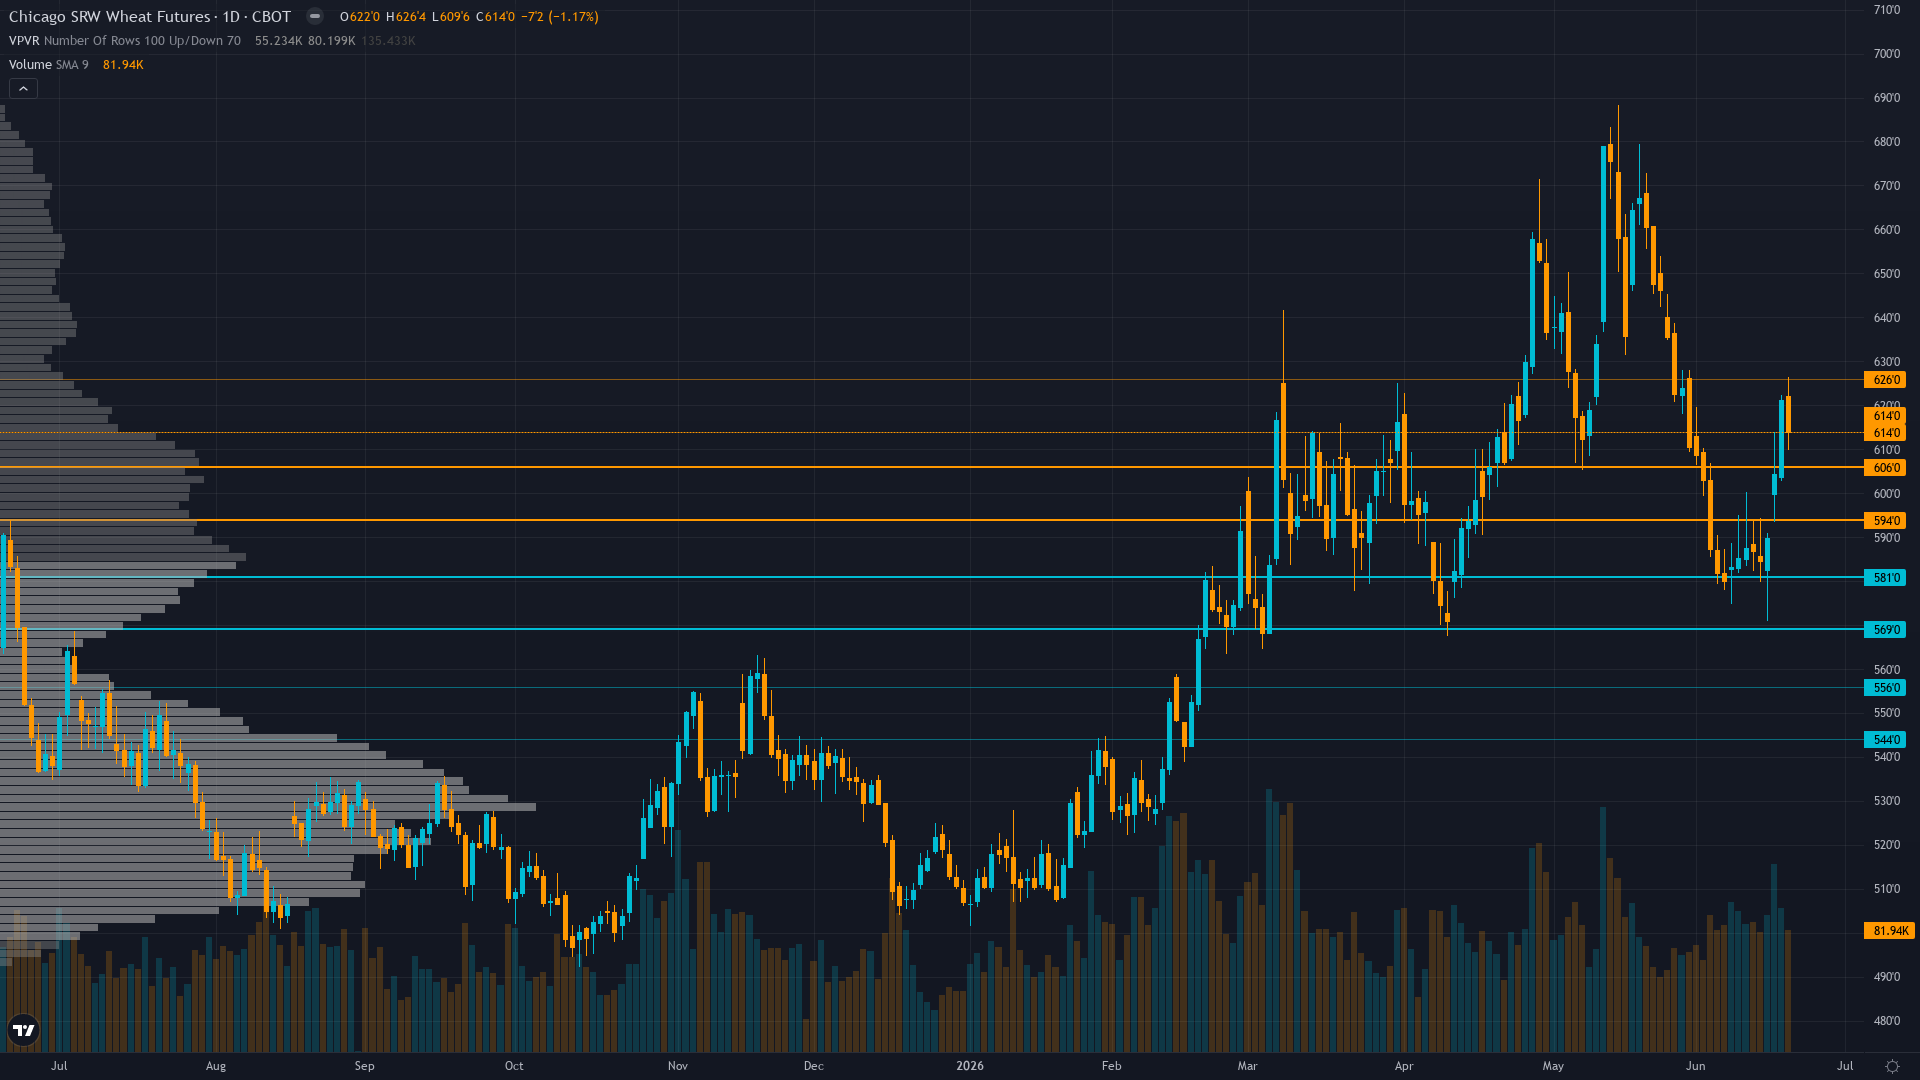
Where Price Sits
wheat holds at 611.1, off 0.31% in a modest retracement from recent levels. wheat futures is in a consolidating after bounce market state, requiring careful assessment of current conditions.
Price at 611.10 bounced 7.2% from mid-June low of 570 (lowest since April 10) breaking above 610 neckline on June 21 with daily range 610-618.13 suggesting emerging uptrend attempt yet RSI oversold low-30s without clear bullish divergence and declining open interest signaling weakening conviction creating consolidation in 600-620 range most probable near-term structure
Trend strength at 5/10 paints a picture of a market with some direction but lacking strong conviction.
Floors & Demand Zones
wheat price has identifiable support zones below current price where buying interest has historically emerged. These zones represent areas where institutional participants have previously defended price, creating potential floors for pullbacks.
How effectively these zones hold depends on the prevailing regime and whether the volume profile confirms institutional participation.
Resistance Architecture
Above current price, ZW futures encounters structural resistance defined by prior supply zones and profit-taking clusters. These barriers must be overcome convincingly for the upside thesis to develop.
The reliability of resistance depends on the number of touches and the volume traded at each level.
Multi-Agent Confluence
What separates high-probability levels from noise is multi-discipline agreement. The key zones for wheat price are those where technical structure aligns with institutional positioning and options market activity.
The Intelligence Behind the Levels
Our multi-agent system analyses key levels from six perspectives simultaneously: technical structure identifies the zones, institutional positioning reveals where smart money is engaged, options flow shows where hedging clusters, fundamentals assess whether levels align with fair value, sentiment measures crowd positioning around levels, and economic data flags catalysts that could trigger level tests.
The result is a set of levels that reflect genuine multi-agent consensus, not the output of a single indicator or a retail trader drawing trendlines.
Our paid reports include specific support and resistance levels identified by six specialist agents — technical structure, institutional positioning, options flow, fundamentals, sentiment, and economic analysis. Not just lines on a chart, but zones validated by multi-discipline confluence.
Start Free — Get the Market of the WeekFree weekly report · No credit card · Upgrade anytime


