Wheat Key Levels This Week — Support, Resistance & Confluence Zones
Wheat key levels breakdown: support zones, resistance zones, confluence and price structure.

Price Architecture
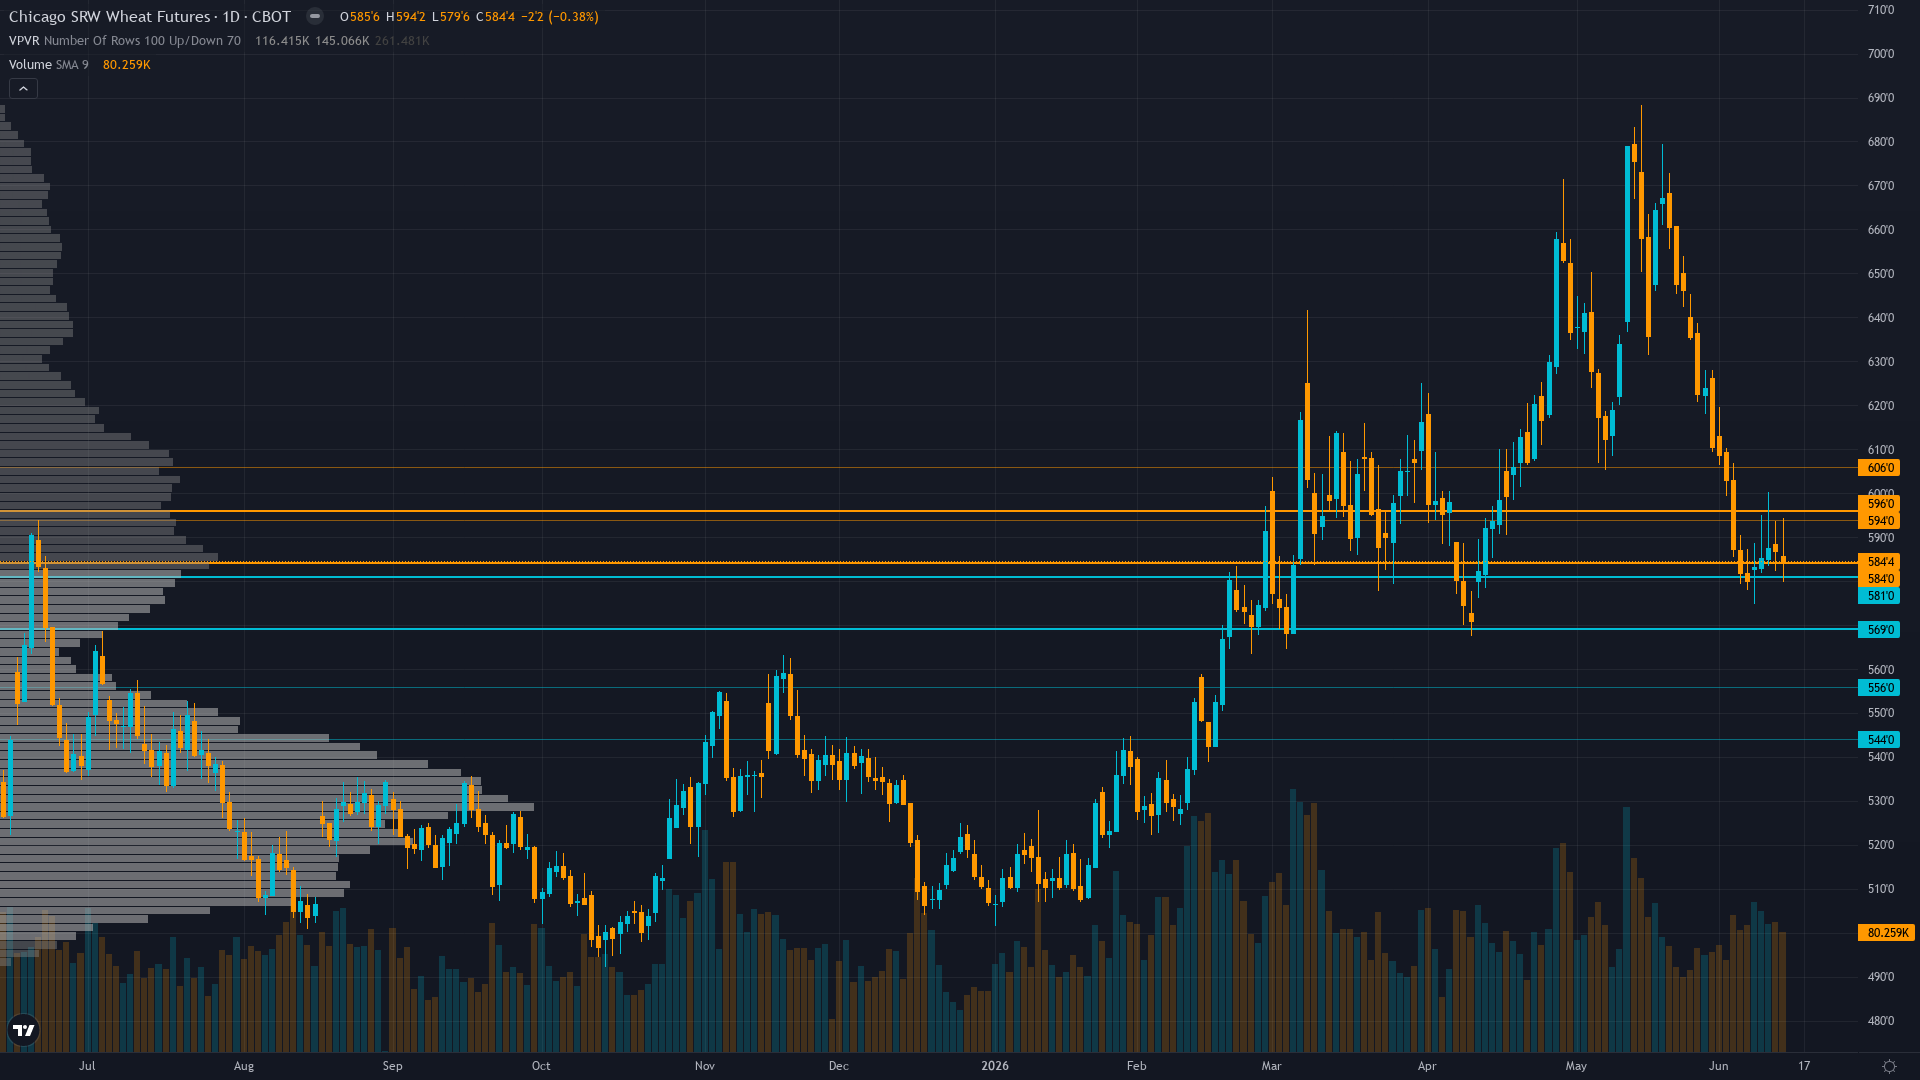
wheat holds at 584.4, off 0.27% in a modest retracement from recent levels. wheat futures is in a consolidating in downtrend market state, requiring careful assessment of current conditions.
Confirmed downtrend with price at 584 well below 50-day MA (~595) and 200-day MA (~605) following breakdown from May 14 two-year highs at 688.25, yet RSI oversold 35-40 range without bullish divergence and declining open interest signaling weakening trend conviction creating setup where consolidation in 575-600 range most probable near-term
Trend strength sits at 4/10, reflecting moderate directional pressure without clear dominance.
Downside Protection
The downside architecture for ZW futures features support zones rooted in prior buying activity. These are not arbitrary lines but areas where real capital has previously been committed.
The reliability of support under TRANSITIONAL - VIX at 19.44 (neutral zone below 20 threshold indicating neither fear nor greed in equity markets), USD at 99.8 DXY showing modest strength creating export competitiveness headwind for U.S. wheat versus Black Sea suppliers, yet macro regime neither supports nor contradicts agricultural fundamentals allowing commodity-specific supply-demand dynamics to dominate directional pricing conditions is shaped by the interplay between volatility regime and historical volume at each level.
Resistance Zone Context
The upside path for wheat price is marked by resistance zones where prior selling activity created structural barriers. Clearing these zones requires either strong momentum or a shift in the fundamental picture.
In the current market state, resistance zones remain key decision points.
Analytical Convergence
The most actionable levels for wheat are those where multiple analytical disciplines converge. When technical structure, institutional positioning, and options flow all point to the same zone, the probability of price reacting there increases meaningfully.
Daily ranges expanded from prior 15-20 cents to current 18-26 cent action following June 11 WASDE breakdown requiring wider stops - sustained move below 575 psychological support or recovery above 600 would trigger accelerated directional moves given failed rally structure from May highs and elevated volatility environment with July 10 WASDE 26 days away representing next major binary catalyst for potential 3-5% move in either direction
Our Multi-Agent Approach to Key Levels
The levels in our paid reports are generated by six specialist agents working in parallel. Technical analysis provides the structural framework, institutional data shows where capital is committed, options flow reveals hedging behaviour, fundamentals anchor levels to value, sentiment gauges crowd positioning, and economic analysis times the catalysts.
The output is a curated set of levels with institutional-grade validation — the kind of multi-dimensional analysis that hedge fund research desks produce, delivered at a fraction of the cost.
Our paid reports include specific support and resistance levels identified by six specialist agents — technical structure, institutional positioning, options flow, fundamentals, sentiment, and economic analysis. Not just lines on a chart, but zones validated by multi-discipline confluence.
Start Free — Get the Market of the WeekFree weekly report · No credit card · Upgrade anytime


