Wheat Key Levels This Week — Support, Resistance & Confluence Zones
Wheat key levels breakdown: support zones, resistance zones, confluence and price structure.

Structural Assessment
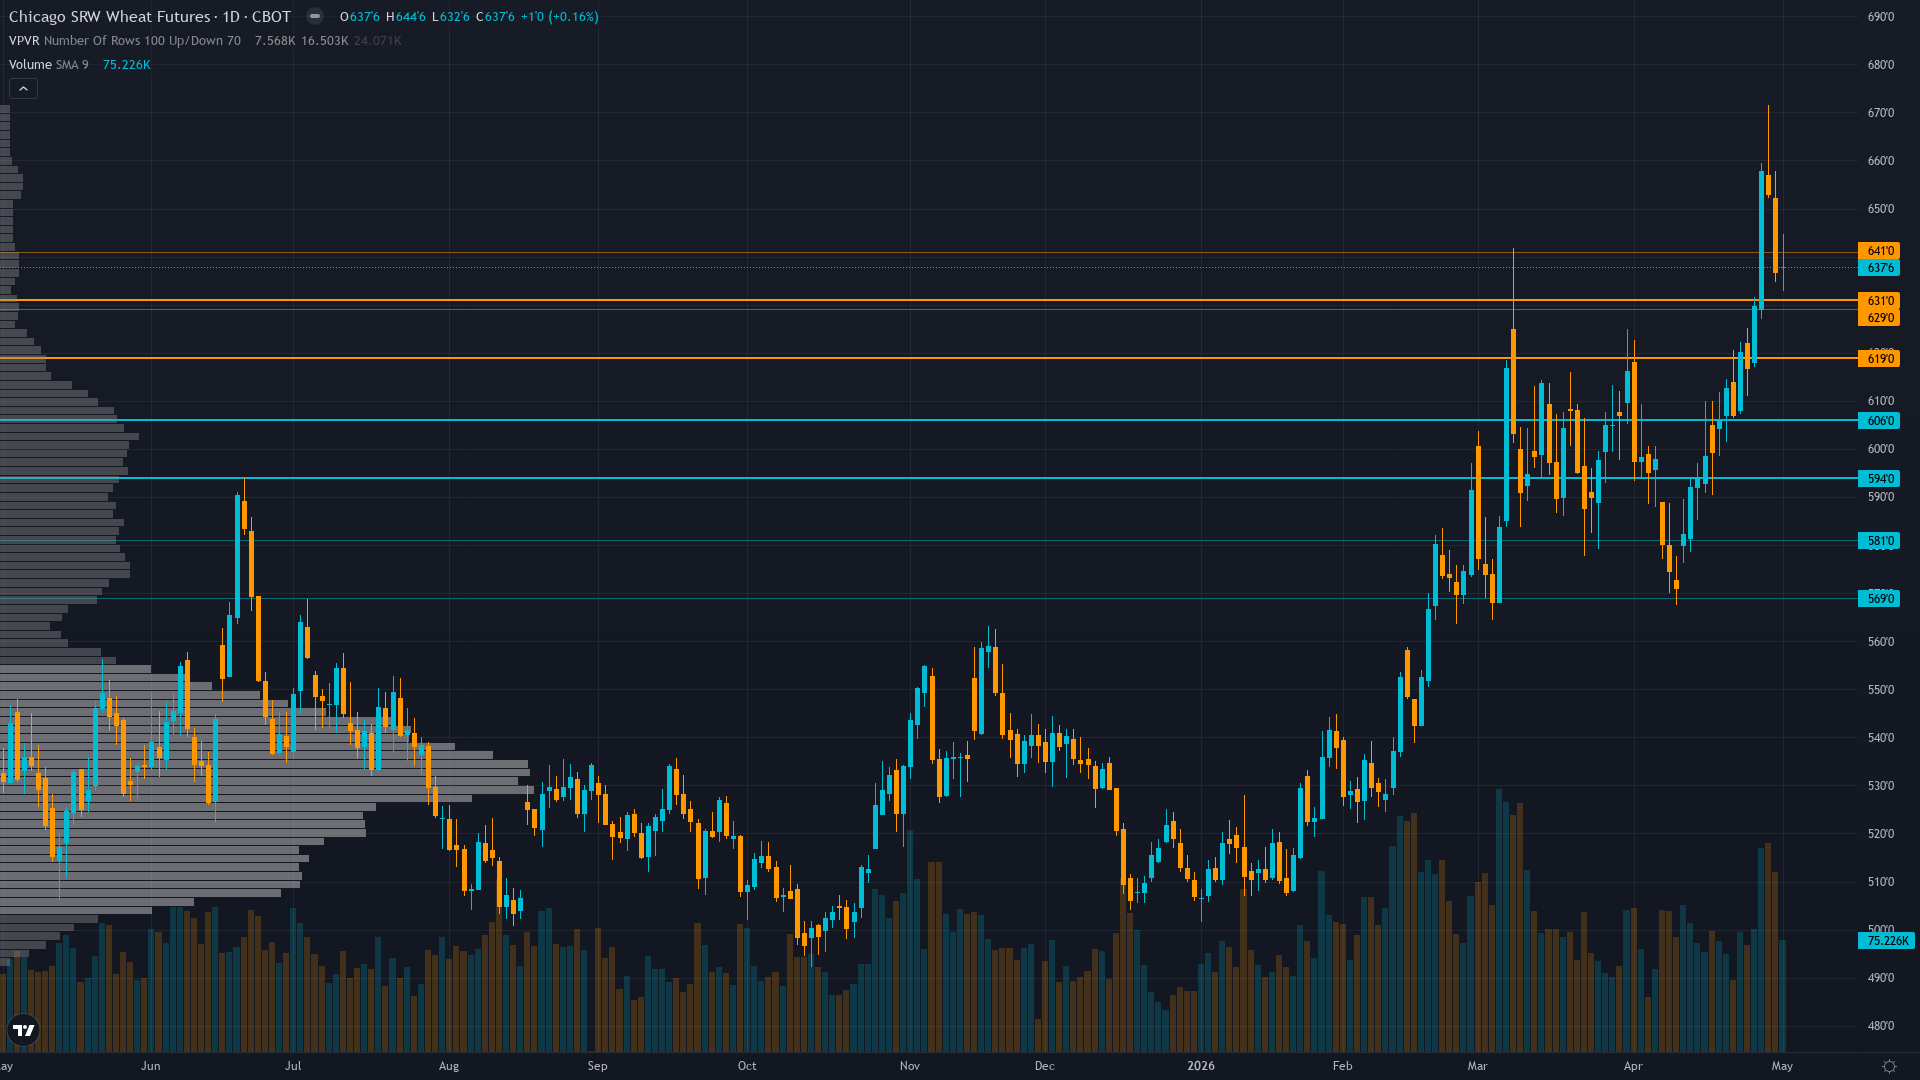
wheat holds at 637.75, up a marginal 0.12% as the market grinds forward. wheat futures is in a trending up market state, requiring careful assessment of current conditions.
Strong uptrend with price at 637.75 up 17.45% YoY near 2-year highs testing 52-week high zone at 671.50 with technical indicators showing Strong Buy signals yet consolidating after rally from October 492 lows
At 7/10, trend strength indicates a solid directional lean without being overextended.
Support Architecture
Support levels for wheat are defined by zones of prior institutional demand. The depth and frequency of prior tests at these levels determines their likely strength.
The strength of support depends on the current DIVERGENT with equities risk-on (VIX 16.89) while commodities price geopolitical tensions (oil $105+) and weather supply disruption creating transitional environment with conflicting cross-currents for agricultural markets regime and volume profile at each level.
Upside Barriers
Resistance levels above CBOT wheat current price represent zones of historical supply. The significance of each level scales with the number of prior tests and the volume traded there.
The current trending up regime influences how aggressively these resistance zones are likely to be tested and whether they hold or fold.
Confluence & Methodology
Confluence is the differentiator between a line on a chart and a level worth trading. For wheat futures, the zones with the highest conviction are those validated across technical, institutional, and derivatives dimensions simultaneously.
Daily ranges expanded from prior 12-18 cents to current 20-30 cent action requiring wider stops - sustained move above 650 or breakdown below 620 would trigger accelerated moves given elevated volatility environment and May 12 WASDE binary event risk approaching
Beyond Lines on a Chart
Our approach to key levels is designed to filter noise from signal. Six independent agents each assess the same price zones from different perspectives. A level confirmed by one discipline is interesting. A level confirmed by four or five is worth building a trade plan around.
This multi-discipline approach means the levels in our paid reports carry institutional-grade confluence — not just lines on a chart, but zones validated across every analytical dimension that matters.
Our paid reports include specific support and resistance levels identified by six specialist agents — technical structure, institutional positioning, options flow, fundamentals, sentiment, and economic analysis. Not just lines on a chart, but zones validated by multi-discipline confluence.
Start Free — Get the Market of the WeekFree weekly report · No credit card · Upgrade anytime


