Wheat Forecast This Week — Outlook, Drivers & Key Levels
This week's Wheat outlook: key drivers, volatility context, risk-opportunity assessment and the week ahead.

Current Market Picture
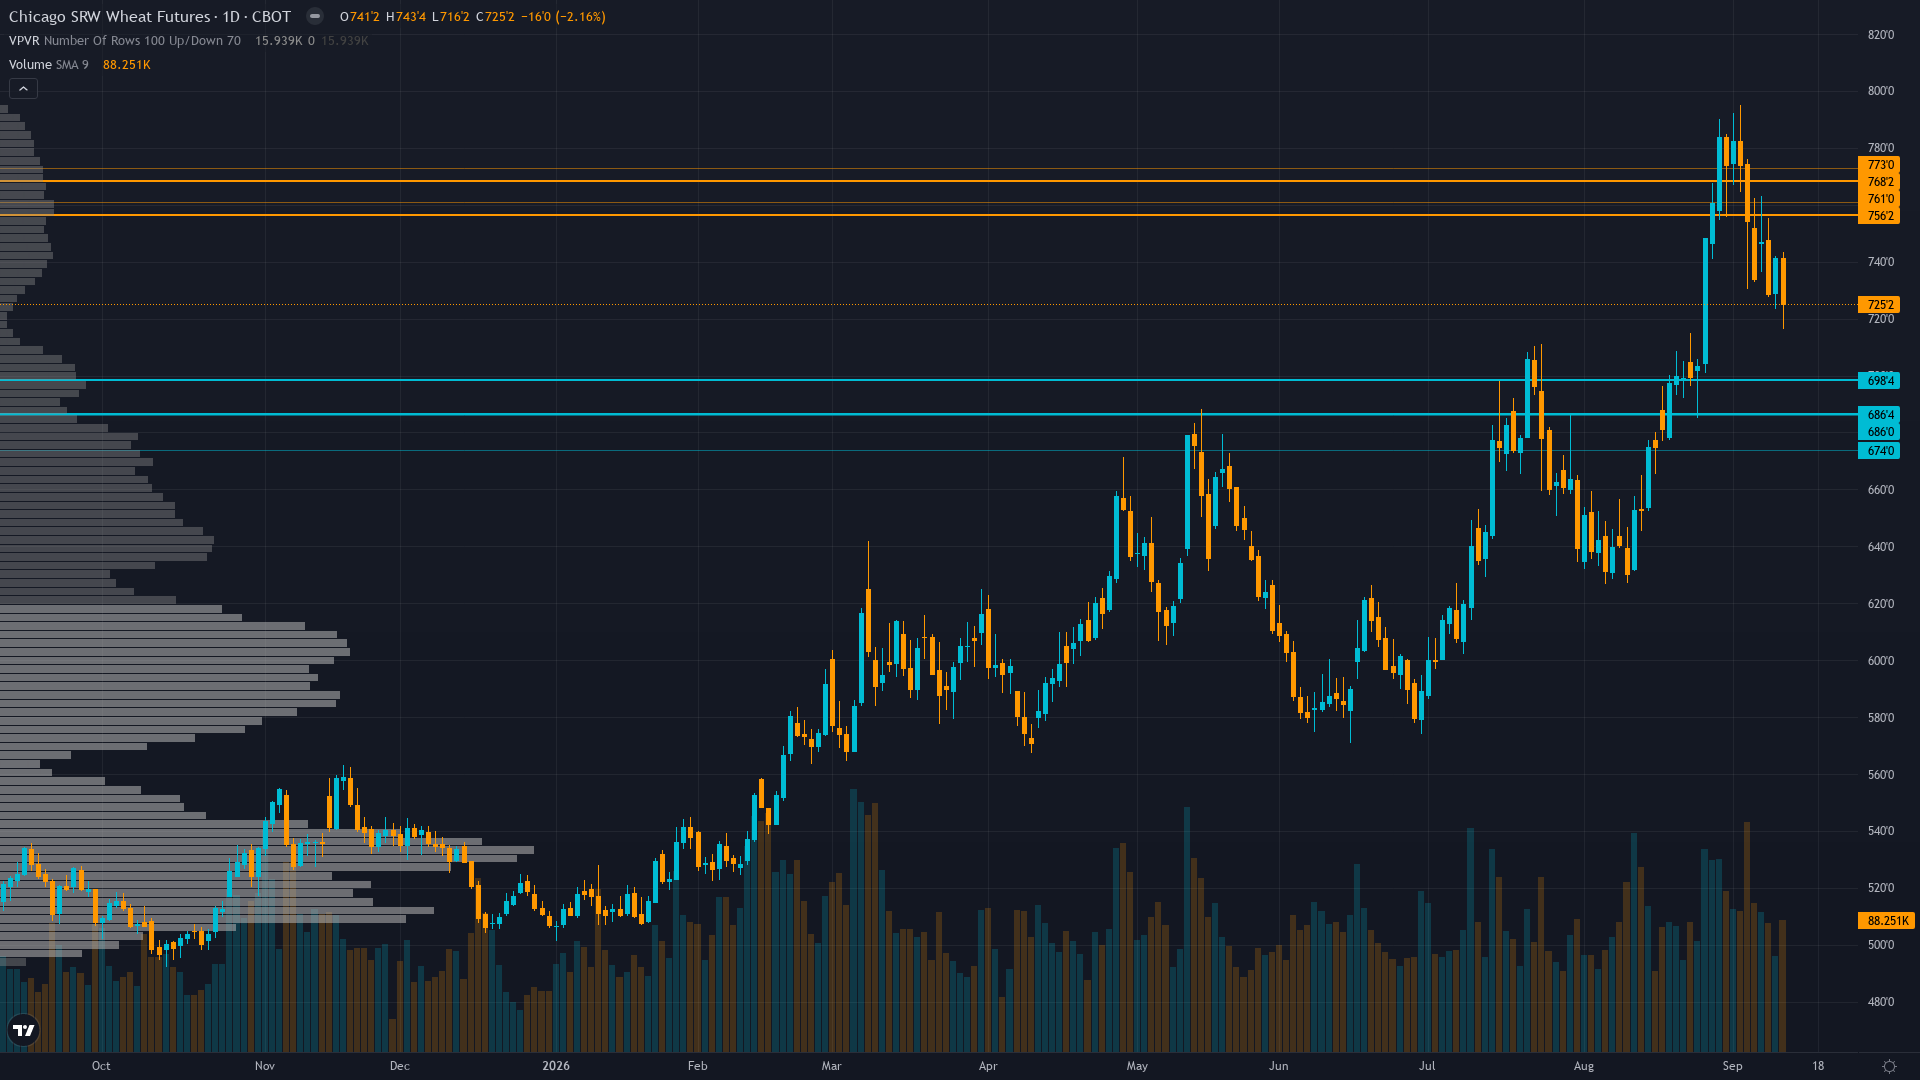
wheat fell to 726.25 on a 1.62% decline, with selling pressure dominating price action. The market in wheat futures is coiling, with narrowing price ranges suggesting stored energy that will eventually release.
Market consolidating after the Sep 11 WASDE with Black Sea structural supply disruption providing a bullish floor, while the extreme speculative long unwind (-14,233 contracts profit-taking) and weak export sales data cap near-term upside, creating a 690-745 range-bound expectation until the next catalyst
Key Drivers This Week
Primary driver: Structural Black Sea export disruption continues with Russia turning to Far East export routes (Bloomberg Sep 12) as Ukrainian drone strikes maintain >90% of Black Sea grain capacity offline, while Russia's suspension of floating export duties through end-2026 (Bloomberg Sep 2) confirms systemic multi-month export impairment that fundamentally tightens global wheat supply availability
Secondary factor: September 11 WASDE confirmed tightening supply dynamics with deteriorating winter wheat conditions and weak export sales at marketing-year lows, providing fresh fundamental validation of the structural supply deficit thesis that reinforces the post-harvest seasonal tailwind into fall/winter
Additional influence: CFTC COT data as of Sep 8 shows non-commercials slashed net long position by -14,233 contracts from +24,703 to +10,470 (98.7th percentile still extreme), representing significant profit-taking after the Aug 28 peak at 767 and removing short-covering fuel while reducing positioning extreme risk for fresh upside
Economic backdrop: TRANSITIONAL macro regime with VIX at ~16 indicating neutral risk appetite, Fed on hold at 3.63% with FOMC economic projections due Sep 16, Treasury 10Y at 4.96% (+18bp weekly) reflecting hawkish repricing, USD stable but elevated creating mild export headwinds, inflation contained at 2.36%
Fundamental assessment: Structurally bullish with Black Sea export disruption (Russia pivoting to Far East routes per Bloomberg Sep 12) compounding smallest US wheat crop since 1970/71, though Sep 11 WASDE showed weak export sales at marketing-year lows providing near-term demand headwind against the structural supply tightening narrative
Price Structure
Price at 726.25 above both 50-day and 200-day moving averages maintaining uptrend structure despite recent -3.94% weekly decline from 740+ levels, RSI neutral 50-55 range, immediate support at 717.8 (today's low per Investing.com) with major support at 692, resistance at 742 (today's high) and major resistance at 767 (52-week high)
Trend strength sits at 6/10, reflecting a market that has directional bias but hasn't reached extreme conviction.
Volatility Regime
Volatility for wheat price sits at the 85th percentile over 90 days — an elevated regime that demands wider risk parameters and faster decision-making. The vol trend is flat, with no meaningful shift across timeframes. Stable vol environments often lull traders before a regime change arrives.
Daily ranges have expanded to 20-30 cent action with the Sep 13 session showing 717.8-742.0 range per Investing.com, requiring wider stops; sustained break below 717.8 support could trigger accelerated selling toward 692, while a recovery above 742 resistance could reactivate the uptrend toward 767-795 zone
What History Shows
CBOT wheat enters September 2026 without a meaningful seasonal lean (48% win rate). New crop year begins, planting outlook matters.
Risk & Opportunity
Primary risk: Diplomatic resolution to the Black Sea crisis restoring Russian/Ukrainian export capacity would remove the primary bullish catalyst, potentially triggering sharp profit-taking from current 726 level toward 680-700 as the supply disruption premium deflates and global stocks reassert as the dominant pricing force (Probability: low)
Primary opportunity: Continued confirmation of Black Sea infrastructure damage as structural (not transient) from the Sep 11 WASDE and Russia's Far East pivot (Bloomberg Sep 12) combined with seasonal tailwind into fall/winter (wheat rises from harvest lows per CME research) could drive price recovery toward 767 resistance retest as the market reprices the multi-month supply deficit against depleted US ending stocks (Timeframe: Next 1-3 weeks as Black Sea alternative route capacity constraints become apparent and September WASDE repricing settles)
This week's edge: The market may be underappreciating that Russia's pivot to Far East export routes (Bloomberg Sep 12) is a logistical workaround with materially higher costs and lower capacity than Black Sea routes — this does not solve the structural supply deficit but merely redistributes it, yet the market's profit-taking reaction to the WASDE suggests traders may be treating the Black Sea disruption as fully priced, when in reality the infrastructure damage is multi-month and Russia has shown no ability to restore Novorossiysk terminal operations, while the Sep-Nov seasonal tailwind (wheat rising from harvest lows per CME research) provides asymmetric upside
Looking Forward
On the calendar, FOMC Economic Projections (Sep 16, 18:00 UTC) with dot plot and Summary of Economic Projections; also Retail Sales (Sep 16, 12:30 UTC); these macro events could impact USD trajectory and thus wheat export competitiveness on Wednesday 16 September carries moderate market-moving potential and warrants attention in trade planning.
The week ahead for wheat price hinges on whether the prevailing consolidating regime can absorb the scheduled catalysts without a regime shift.
This analysis covers one dimension. Our full weekly report combines six specialist agents into a single actionable briefing with directional bias, key levels, and risk-opportunity matrix.
Start Free — Get the Market of the WeekFree weekly report · No credit card · Upgrade anytime