Wheat Forecast This Week — Outlook, Drivers & Key Levels
This week's Wheat outlook: key drivers, volatility context, risk-opportunity assessment and the week ahead.

Current Market Picture
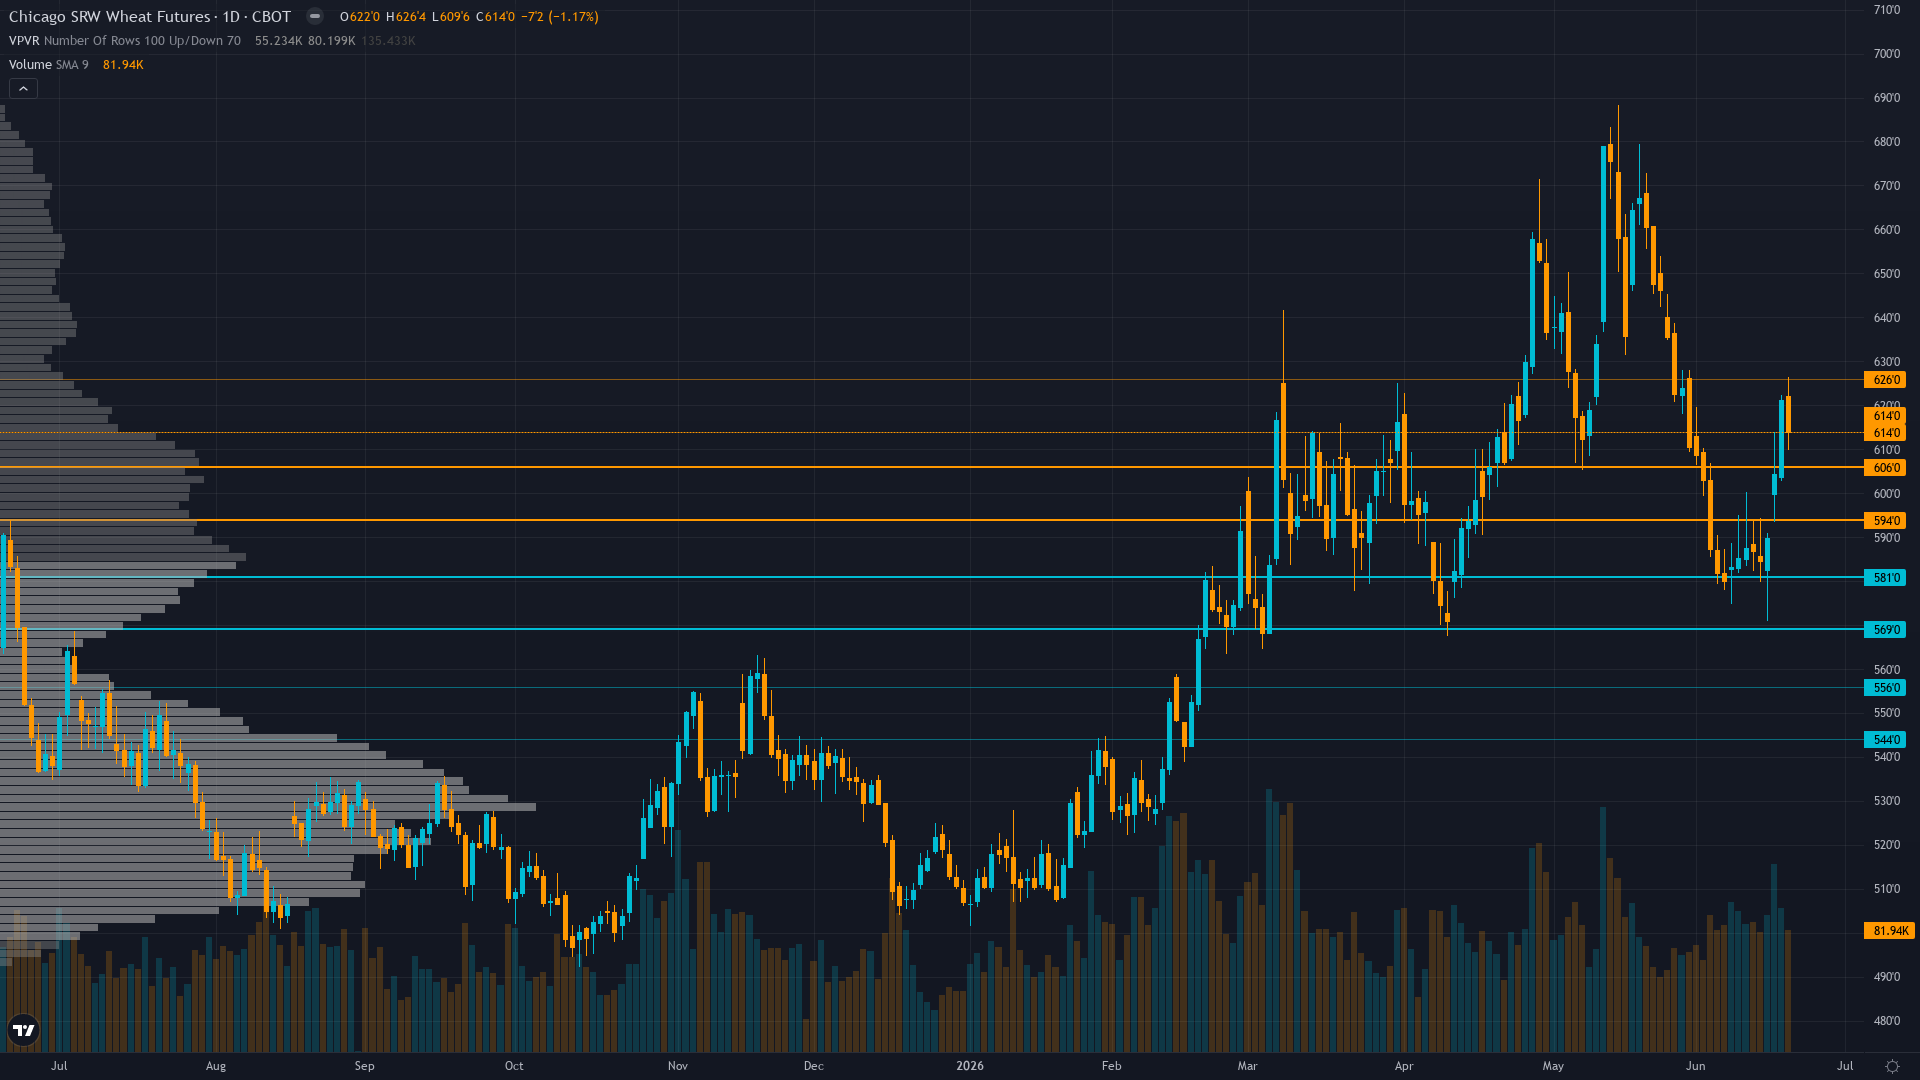
wheat holds at 611.1, off 0.31% in a modest retracement from recent levels. wheat futures is in a consolidating after bounce market state, requiring careful assessment of current conditions.
Cautiously neutral to mildly bearish following June 11 WASDE rally failure with market viewing advance from 570 to current 611 as technical bounce within structural range expecting seasonal June-August harvest pressure to cap upside near 620 resistance as global oversupply at 275.0 MMT stocks provides structural buffer against U.S. regional drought concerns
Key Drivers This Week
Primary driver: June 11 WASDE (10 days ago) confirmed catastrophic U.S. production collapse to 1,048 million bushels winter wheat (down 25% YoY, lowest since 1972 per Reuters June 11) with Hard Red Winter at 1957 lows, yet market trading at 611 cents following 7% bounce from mid-June 570 lows suggests incomplete pricing of supply shock against global 275.0 MMT stocks creating fundamental-price tension requiring resolution
Secondary factor: Post-input development identified: Current price 611.10 as of June 21 confirms Technical agent's bounce thesis from 570 support with daily range 610-618.13 per Investing.com, representing material 7.2% rally in 11 days yet price remains 11.2% below May 14 two-year highs at 688.25 suggesting market pricing partial drought premium without full commitment to production catastrophe scenario
Additional influence: Institutional positioning at historic bearish extreme with managed money net short -79,407 contracts as of June 9 COT data (reported June 12) representing largest single bearish positioning level on record back to 2006 per Institutional agent, removing downside fuel yet creating explosive short-covering potential if July 10 WASDE confirms additional production downgrades from persistent 69% drought coverage affecting winter wheat production areas
Economic backdrop: TRANSITIONAL macro regime with VIX 16.78 neutral, USD strengthening to 100.76 DXY creating modest export competitiveness headwind, crude oil declining 21% MoM to $77.33 reducing input costs (diesel, fertilizer), Fed held at 3.5-3.75% under new Chair Warsh with June 17 FOMC removing dovish language marking subtle hawkish shift yet minimal direct agricultural relevance beyond USD transmission mechanism
Fundamental assessment: Profoundly bullish U.S. supply-side dynamics with June 11 WASDE confirming winter wheat production at 1,048 million bushels (down 25% YoY, lowest since 1972) and Hard Red Winter at 1957 lows per Reuters June 11 report with U.S. ending stocks down 18% to 762 million bushels, yet global stocks at 275.0 MMT (down only 4.2 MMT from 2025/26) with 34.52% stocks-to-use ratio creates fundamental tension where catastrophic U.S. regional supply destruction meets global structural surplus baseline requiring export flow monitoring to determine whether domestic tightness translates to sustained price premium
Price Structure
Price at 611.10 bounced 7.2% from mid-June low of 570 (lowest since April 10) breaking above 610 neckline on June 21 with daily range 610-618.13 suggesting emerging uptrend attempt yet RSI oversold low-30s without clear bullish divergence and declining open interest signaling weakening conviction creating consolidation in 600-620 range most probable near-term structure
Trend strength at 5/10 paints a picture of a market with some direction but lacking strong conviction.
Upside & Downside
Primary risk: Continued breakdown below 600 psychological support toward testing 570-575 range as June-August seasonally weak Northern Hemisphere harvest pressure combines with global stocks at 275.0 MMT (34.52% stocks-to-use ratio) reasserting structural oversupply narrative dominance over U.S. regional drought concerns while managed money record net short -79,407 contracts already reflects bearish positioning consensus removing additional downside fuel (Probability: medium)
Primary opportunity: July 10 WASDE confirms additional U.S. production downgrades beyond June 11 estimates from persistent 69% drought coverage affecting winter wheat areas with only 26% spring wheat rated good-to-excellent (versus 52% last year) triggering explosive short-covering rally from current record net short -79,407 positioning toward 630-650 range as late-season weather stress materializes sustained yield losses exceeding current market pricing at 611 cents creating classic squeeze scenario where specs forced to cover extreme shorts (Timeframe: Next 3-4 weeks through July 10 WASDE and critical late-June/early-July harvest completion window for final 2026 production data from drought-affected Southern Plains regions providing market clarity on whether June 11 WASDE catastrophic production forecasts represent floor or underestimate of actual damage)
This week's edge: Market may be underestimating tail-risk from June 11 WASDE production catastrophe (1,048 million bushels lowest since 1972, Hard Red Winter at 1957 lows per Reuters) where managed money record net short -79,407 contracts (largest since 2006) creates asymmetric short-covering opportunity if July 10 WASDE or late-June harvest data confirms yield losses beyond current pricing at 611 cents, yet desk acknowledges global 34.52% stocks-to-use ratio and seasonal June-August harvest pressure create genuine structural headwinds requiring measured conviction 7 versus entrenched bullish stance given 2-consecutive miss history demanding analytical discipline
Volatility Context
At the 68th percentile, wheat price volatility sits in a normal range, neither compressed enough to signal a breakout nor elevated enough to demand caution. Realised vol is holding its current level, suggesting the market has found a temporary equilibrium in its risk pricing.
Seasonal Patterns
The seasonal tailwind for CBOT wheat in June 2026 is well-documented at 65%. Winter wheat harvest begins, weather-driven.
Looking Forward
All eyes turn to USDA July 2026 WASDE Report with updated winter wheat production estimates incorporating final spring weather conditions and harvest progress data from drought-affected Southern Plains areas plus initial 2026/27 crop year demand projections determining whether June 11 production downgrades represent floor or require further revision as late-season harvest data materializes yield losses on Friday 10 July, which carries enough weight to force a decisive directional move.
The week ahead for wheat price hinges on whether the prevailing consolidating after bounce regime can absorb the scheduled catalysts without a regime shift.
This analysis covers one dimension. Our full weekly report combines six specialist agents into a single actionable briefing with directional bias, key levels, and risk-opportunity matrix.
Start Free — Get the Market of the WeekFree weekly report · No credit card · Upgrade anytime


