Wheat Forecast This Week — Outlook, Drivers & Key Levels
This week's Wheat outlook: key drivers, volatility context, risk-opportunity assessment and the week ahead.

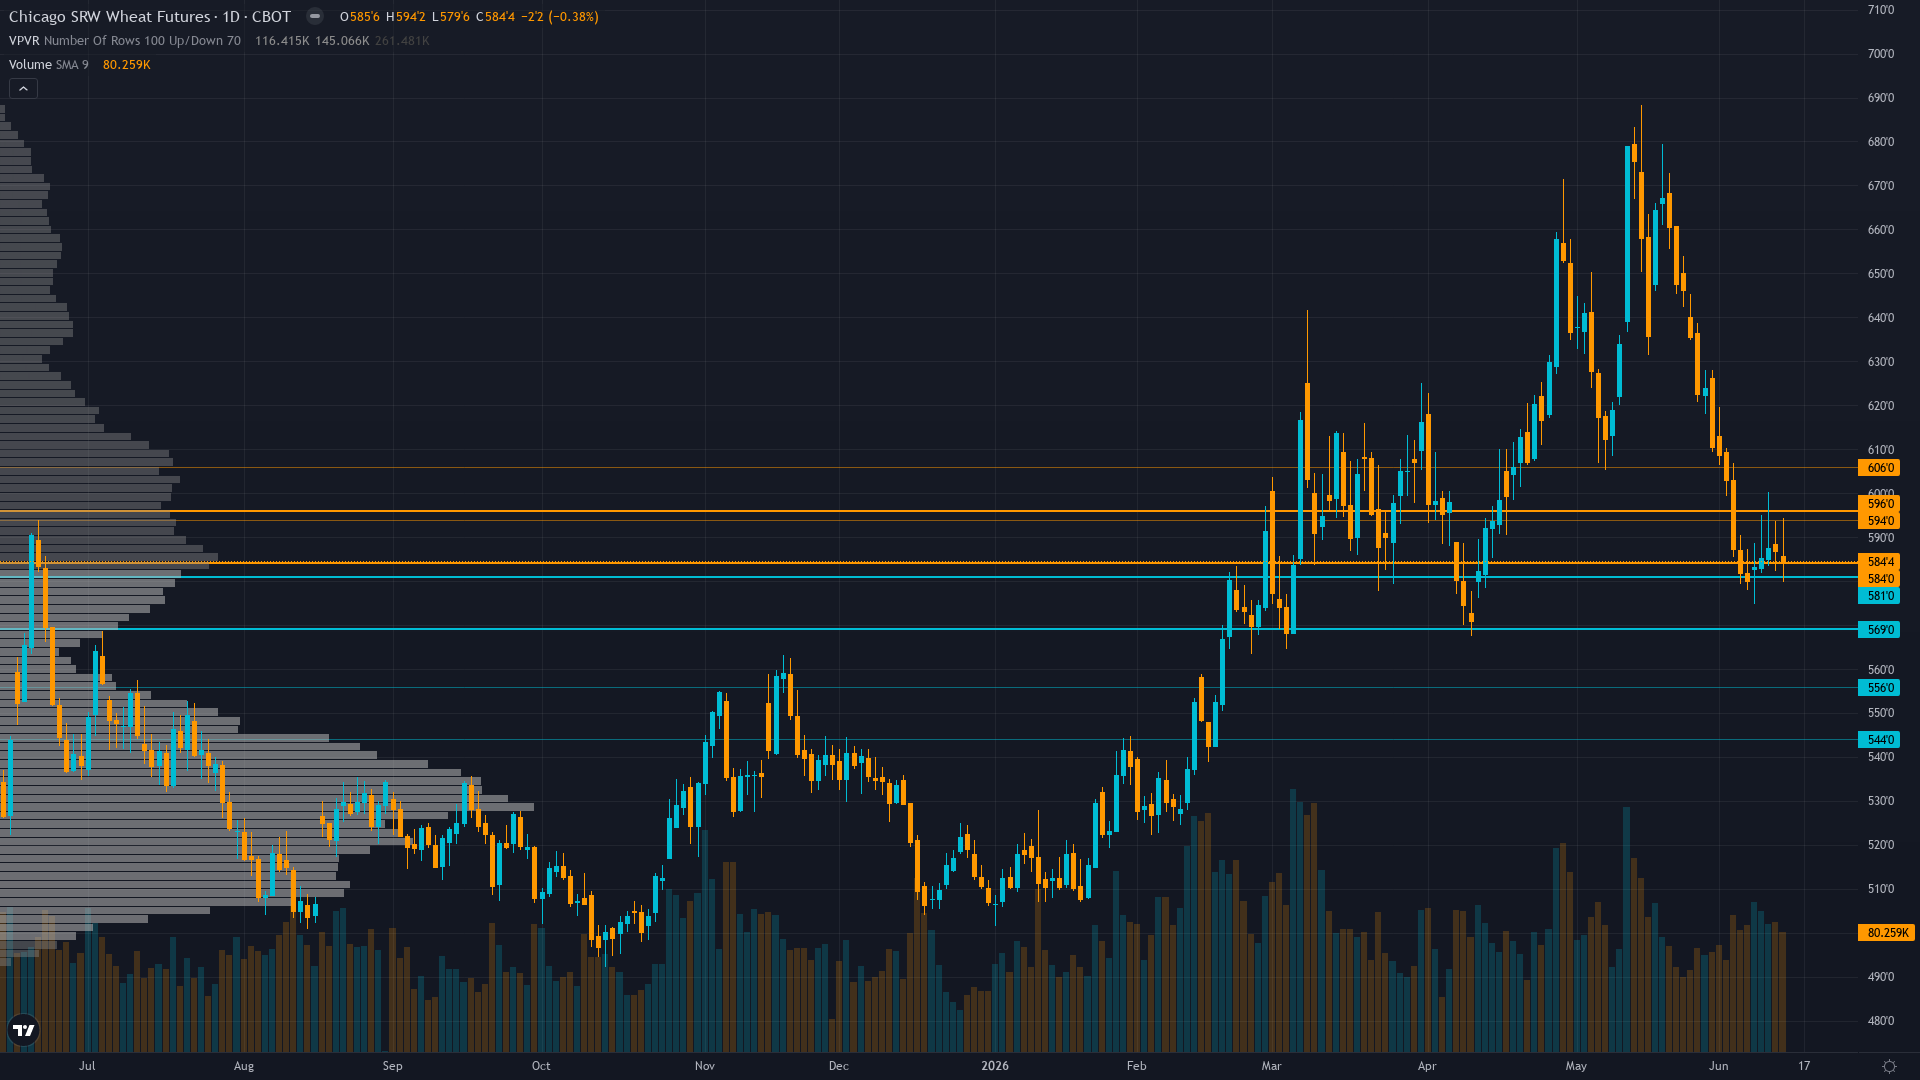
This Week's Starting Point
At 584.4, wheat has eased 0.27% in a controlled retreat. wheat futures is in a consolidating in downtrend market state, requiring careful assessment of current conditions.
Bearish following June 11 WASDE production downgrades with market viewing U.S. supply destruction as insufficient to overcome global stocks-to-use ratio at 45% and weak export demand expecting seasonal June-August harvest pressure to drive prices toward 550-575 support as structural oversupply narrative dominates
Forces in Play
Primary driver: June 11 WASDE (released 3 days ago) confirmed 27% YoY production collapse to 1.03 billion bushels (lowest since 1972) with Hard Red Winter at 1957 lows per Reuters, yet market trading at 584 cents suggesting global stocks-to-use ratio of 45% and weak export demand are overwhelming U.S. regional supply destruction in pricing hierarchy creating profound fundamental-price disconnect
Secondary factor: Post-input development identified via mandatory news scan: Managed money net short positioning exploded from -57,871 contracts (June 2 COT) to estimated -77,593 contracts (June 9 COT) representing largest bearish positioning extreme on record back to 2006 per Institutional data, yet this creates classic contrarian setup where specs are maximally short against worst U.S. production since 1972 removing downside fuel
Additional influence: Entering peak Northern Hemisphere harvest pressure window (June-August historically weakest seasonal period for wheat) with current price action at 584 ALIGNING with seasonal bearish tendency, yet fundamental conflict persists as June 11 USDA report confirms Plains drought forced Hard Red Winter to lowest production since 1957 creating tail-risk scenario where market may be underpricing sustained yield losses
Economic backdrop: TRANSITIONAL macro regime with VIX 19.44 neutral, USD at 99.8 DXY creating modest export competitiveness headwind for U.S. wheat, crude oil stable creating neutral input cost environment for agricultural margins, EM demand weakness cited in Economic agent data as structural headwind to U.S. wheat export pricing power
Fundamental assessment: Profoundly conflicted - June 11 WASDE confirmed most catastrophic U.S. wheat production since 1972 at 1.03 billion bushels (down 27% YoY) with Hard Red Winter at 1957 lows per Reuters June 11 report, yet global stocks-to-use ratio at 45% elevated versus 38% historical norm with weak U.S. export demand (down 15% YoY) suggesting oversupply narrative dominates despite regional U.S. supply destruction
Technical Landscape
Confirmed downtrend with price at 584 well below 50-day MA (~595) and 200-day MA (~605) following breakdown from May 14 two-year highs at 688.25, yet RSI oversold 35-40 range without bullish divergence and declining open interest signaling weakening trend conviction creating setup where consolidation in 575-600 range most probable near-term
Trend strength sits at 4/10, reflecting moderate directional pressure without clear dominance.
Risk-Reward Assessment
Primary risk: Continuation of breakdown below 575 support toward testing 550-560 psychological levels as June-August seasonally weak harvest pressure combines with weak export demand (down 15% YoY) and global stocks-to-use ratio at 45% reasserting oversupply narrative dominance over U.S. regional drought concerns while managed money net short -77,593 contracts already reflects bearish positioning consensus (Probability: medium)
Primary opportunity: July 10 WASDE confirms additional U.S. production downgrades from persistent drought beyond June 11 estimates or export demand stabilizes triggering short-covering rally from current record net short -77,593 positioning back above 600 toward 620 as late-season harvest data materializes yield losses exceeding current market pricing at 584 cents creating classic squeeze scenario where specs forced to cover extreme shorts (Timeframe: Next 3-4 weeks through July 10 WASDE and critical June harvest completion window for final 2026 production data from drought-affected Southern Plains regions)
This week's edge: Market may be underestimating tail-risk from June 11 WASDE production catastrophe (1.03 billion bushels lowest since 1972, Hard Red Winter at 1957 lows per Reuters) where managed money record net short -77,593 contracts creates asymmetric short-covering opportunity if July 10 WASDE or harvest data confirms yield losses beyond current pricing at 584 cents, yet desk acknowledges global 45% stocks-to-use ratio and 15% export demand decline create genuine structural headwinds requiring measured conviction 5 versus entrenched bullish stance
Risk Environment
With vol at the 68th percentile over 90 days, wheat price is in a measured regime that doesn't require unusual adjustments. Volatility is stable, with realised vol holding steady across timeframes. This equilibrium can persist but eventually resolves into expansion or contraction.
Daily ranges expanded from prior 15-20 cents to current 18-26 cent action following June 11 WASDE breakdown requiring wider stops - sustained move below 575 psychological support or recovery above 600 would trigger accelerated directional moves given failed rally structure from May highs and elevated volatility environment with July 10 WASDE 26 days away representing next major binary catalyst for potential 3-5% move in either direction
Seasonal Context
Historically, June 2026 has favoured the upside for CBOT wheat (65% win rate). Winter wheat harvest begins, weather-driven.
Week Ahead Outlook
The next major catalyst is USDA July 2026 WASDE Report with updated winter wheat production estimates incorporating final harvest data from Southern Plains and initial 2026/27 demand projections determining whether June 11 production downgrades represent floor or require further revision as harvest progresses on Friday 10 July — a high-impact event that could materially shift the directional picture.
For wheat, the balance between existing momentum and scheduled risk events sets the stage for the week ahead.
This analysis covers one dimension. Our full weekly report combines six specialist agents into a single actionable briefing with directional bias, key levels, and risk-opportunity matrix.
Start Free — Get the Market of the WeekFree weekly report · No credit card · Upgrade anytime


