Wheat COT & Institutional Positioning — Smart Money Analysis
Wheat institutional positioning: COT data, sentiment analysis and smart money flow assessment.

Institutional Positioning
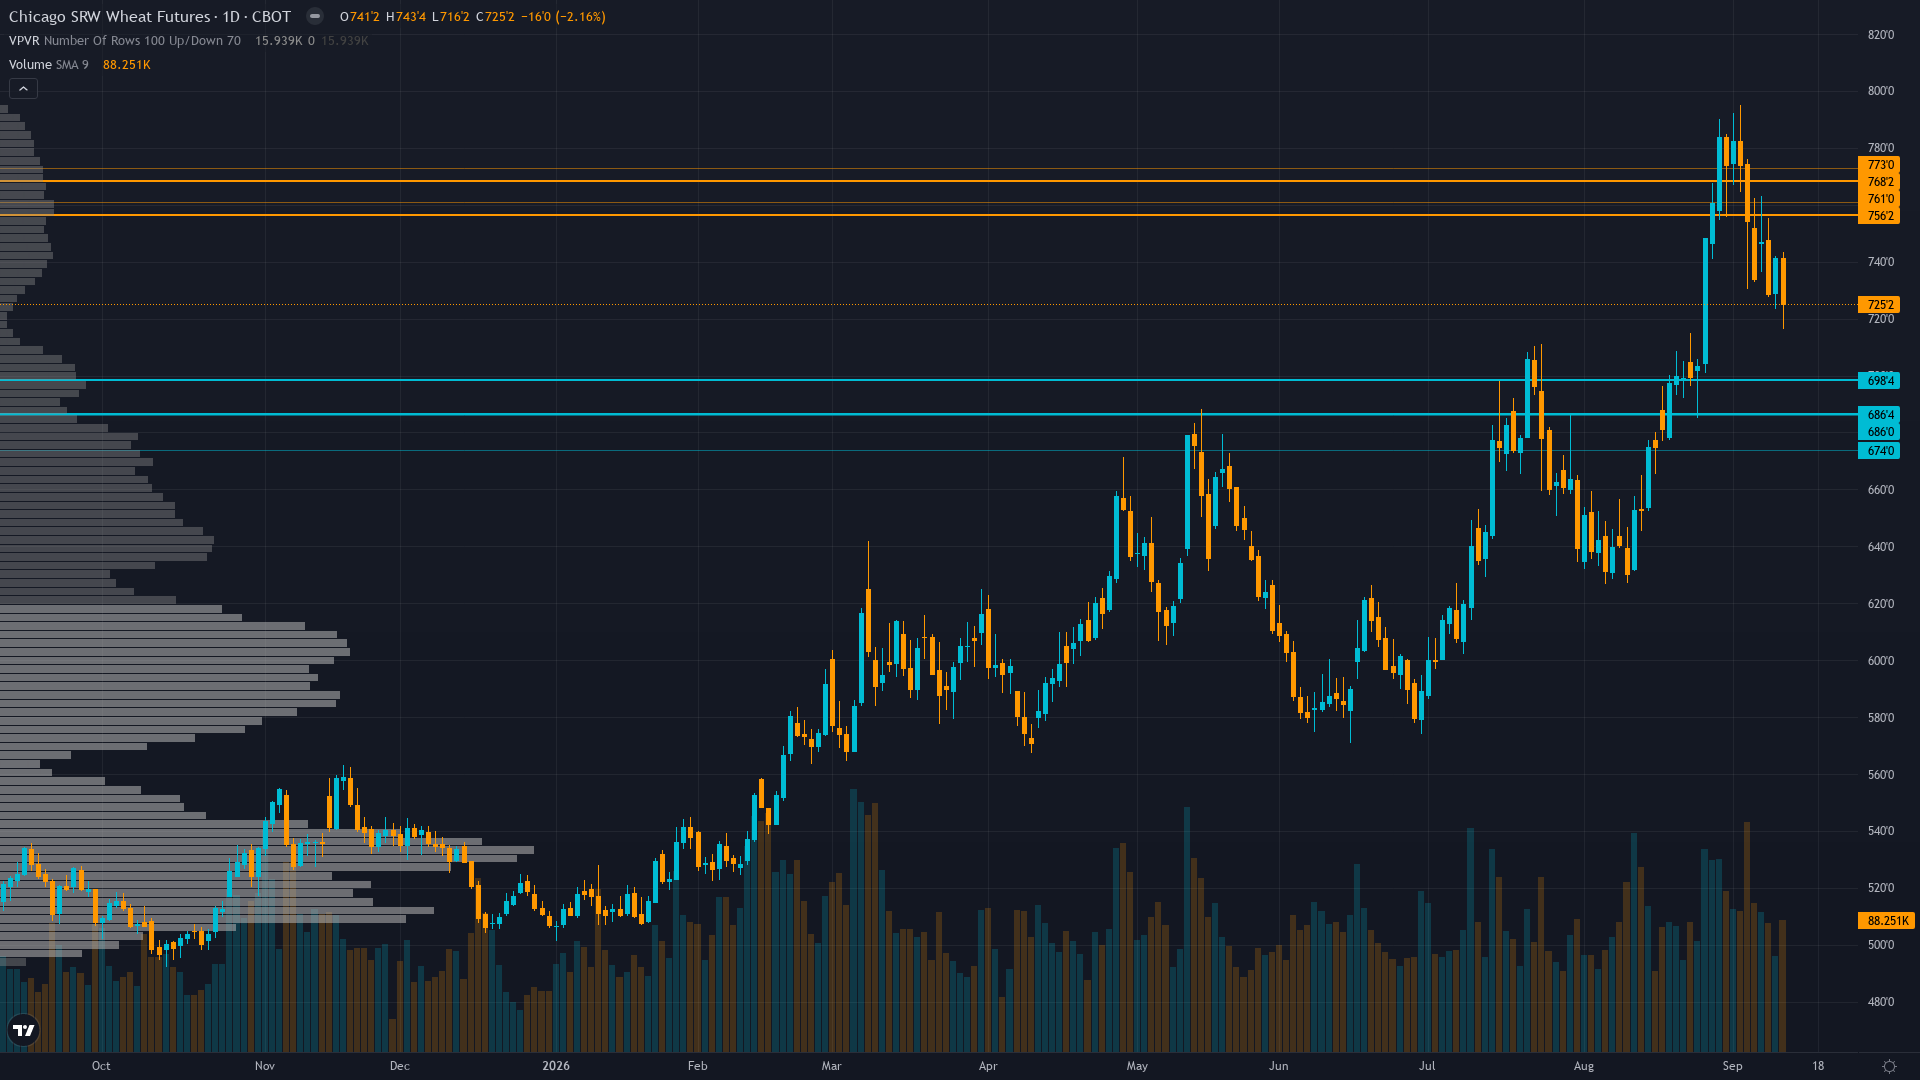
Trading at 726.25 after a 1.62% slide, wheat faces sustained selling interest.
Non-commercials net long +10,470 contracts at 98.7th percentile of 3-year range (CFTC Sep 8), down -14,233 contracts week-over-week as speculators took significant profits from extreme long levels following the Sep 11 WASDE, while commercials remain net short -12,548 creating classic divergence
Where We Agree & Diverge
Market consensus: Market consolidating after the Sep 11 WASDE with Black Sea structural supply disruption providing a bullish floor, while the extreme speculative long unwind (-14,233 contracts profit-taking) and weak export sales data cap near-term upside, creating a 690-745 range-bound expectation until the next catalyst
Primary driver: Structural Black Sea export disruption continues with Russia turning to Far East export routes (Bloomberg Sep 12) as Ukrainian drone strikes maintain >90% of Black Sea grain capacity offline, while Russia's suspension of floating export duties through end-2026 (Bloomberg Sep 2) confirms systemic multi-month export impairment that fundamentally tightens global wheat supply availability
Consensus Gaps
Mild divergence: the desk's BULLISH structural lean (Black Sea disruption as multi-month infrastructure crisis) aligns broadly with consensus on supply tightness but the market has been profit-taking from extreme long positioning (-14,233 contracts unwound), suggesting the crowd is less confident in near-term upside than the desk — the desk's edge lies in recognizing Russia's Far East pivot as confirmation of systemic impairment rather than a solution, a nuance not fully reflected in current consolidation pricing
Sentiment Analysis
Positioning in wheat futures is balanced, with neither bulls nor bears holding a decisive edge. Neutral sentiment typically precedes a directional catalyst.
Derivatives Intelligence
Limited directional signal from thin agricultural options markets; September implied volatility previously at 42.19% (Aug 21) was well above realised vol of 35-37%, suggesting elevated premium consistent with the Black Sea binary event environment; CME CVOL data available for forward-looking risk expectations
Net Assessment
The institutional landscape for wheat price shows neutral sentiment. Trend strength registers at 6/10, suggesting meaningful but not extreme directional bias. The combination of positioning data, sentiment, and options flow provides context for understanding where smart money is leaning heading into the week.
This analysis covers one dimension. Our full weekly report combines six specialist agents into a single actionable briefing with directional bias, key levels, and risk-opportunity matrix.
Start Free — Get the Market of the WeekFree weekly report · No credit card · Upgrade anytime