TRANSITIONAL - VIX AT 16.78 (JUNE 19, DOWN FROM 19.44 JUNE 12) BELOW 20 THRESHOLD INDICATING NEUTRAL EQUITY PSYCHOLOGY NEITHER FEAR NOR GREED, USD AT 100.76 DXY STRENGTHENING MODESTLY CREATING EXPORT COMPETITIVENESS HEADWIND FOR U.S. WHEAT VERSUS BLACK SEA SUPPLIERS, CRUDE OIL RETREATING TO $77.33 (DOWN 21% MOM JUNE 19) EASING INPUT COSTS, CREATING MIXED CROSS-CURRENTS WHERE IMPROVING RISK APPETITE AND DECLINING ENERGY COSTS SUPPORT AGRICULTURAL MARGINS YET USD STRENGTH COMPONENT CREATES PERSISTENT HEADWIND ALLOWING COMMODITY-SPECIFIC SUPPLY-DEMAND FUNDAMENTALS TO DOMINATE DIRECTIONAL DYNAMICS
Institutional Positioning
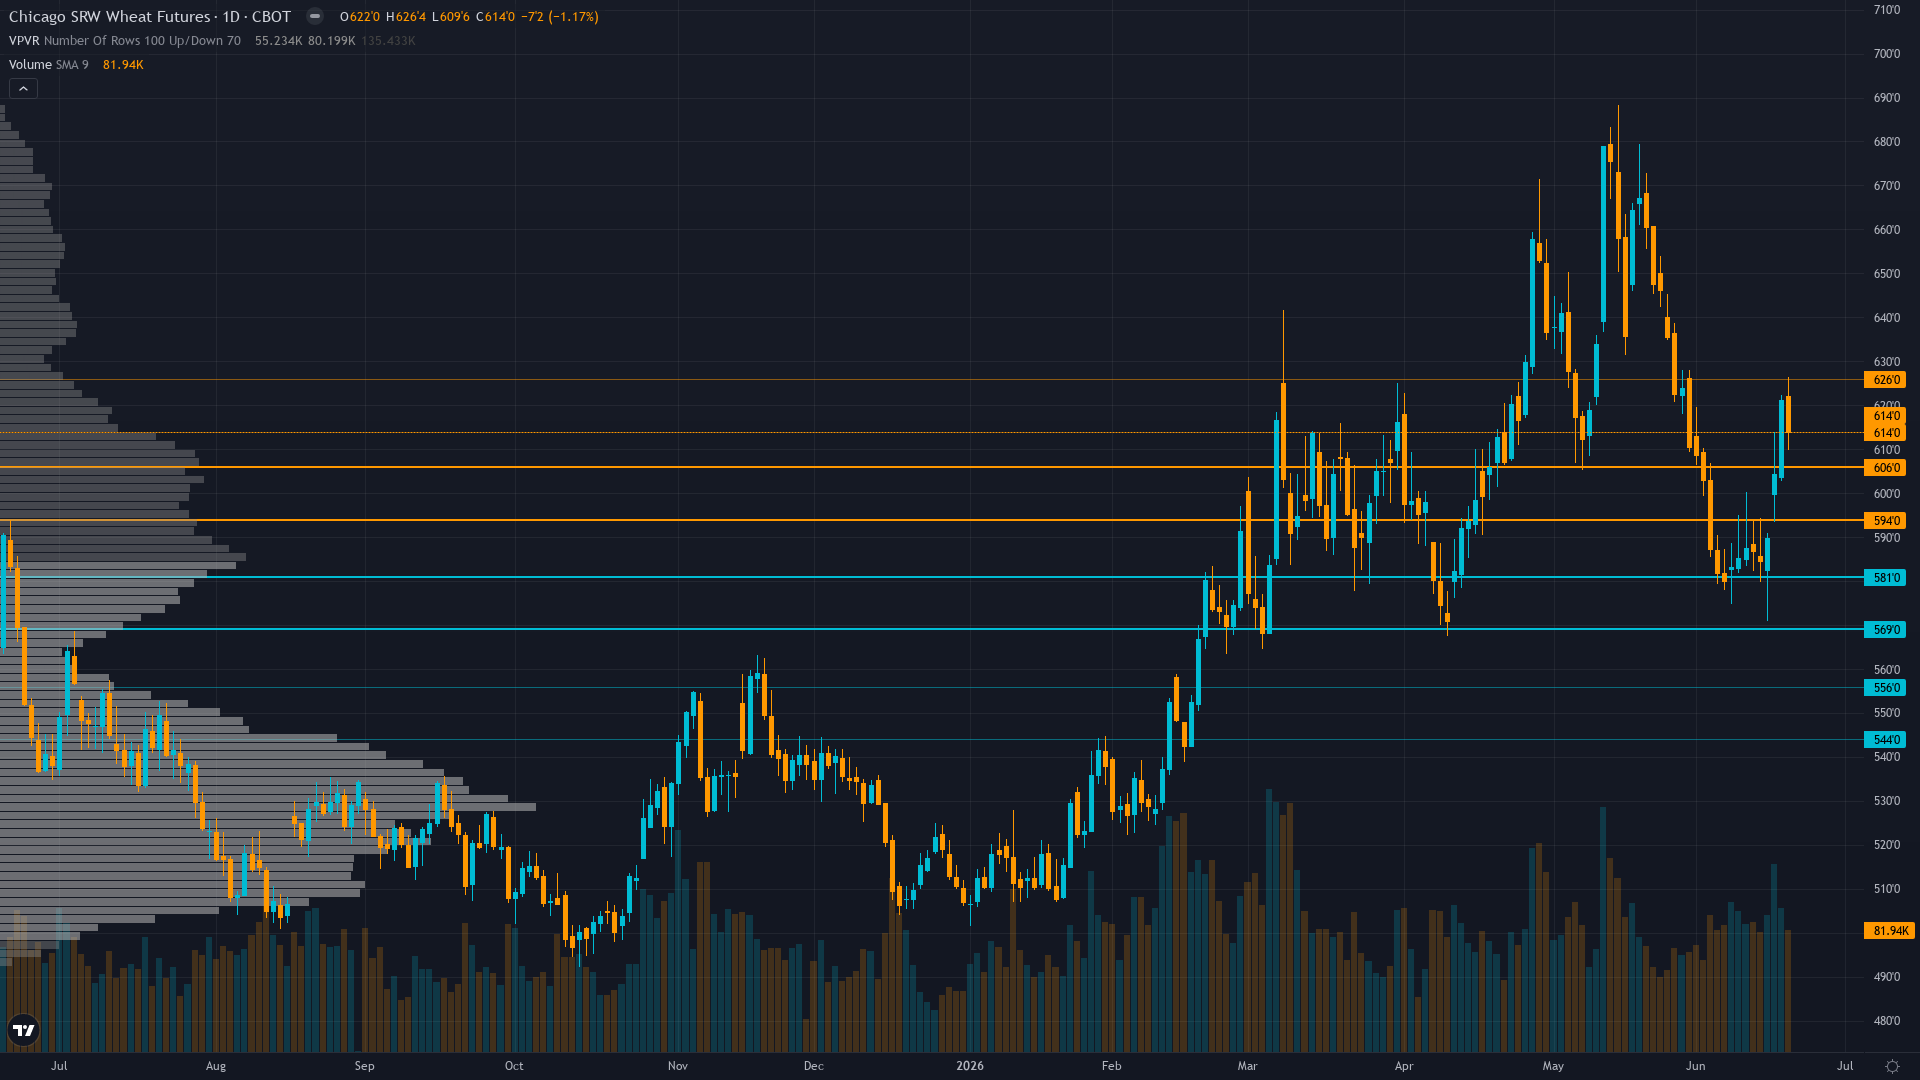
At 611.1, wheat has eased 0.31% in a controlled retreat.
Managed money at historic net short -79,407 contracts per June 9 COT (reported June 12) representing largest bearish positioning extreme on record since 2006 with 65,103 longs versus 142,696 shorts creating asymmetric short-covering risk if market reprices June 11 WASDE production shock beyond current 611 level yet positioning removes squeeze fuel that characterized prior rallies
Crowd Psychology
Neither side has committed heavily to wheat futures, leaving sentiment in a neutral zone that offers little directional guidance on its own.
Options Flow
Implied volatility at 30.87% for July 2026 options (ZWN26) with 5 days to June 26 expiration reflects moderate two-way risk yet thin agricultural options markets provide minimal directional signal with no notable skew or unusual positioning data accessible creating limited options intelligence for directional bias formation
Market Consensus vs Our Analysis
Market consensus: Cautiously neutral to mildly bearish following June 11 WASDE rally failure with market viewing advance from 570 to current 611 as technical bounce within structural range expecting seasonal June-August harvest pressure to cap upside near 620 resistance as global oversupply at 275.0 MMT stocks provides structural buffer against U.S. regional drought concerns
Primary driver: June 11 WASDE (10 days ago) confirmed catastrophic U.S. production collapse to 1,048 million bushels winter wheat (down 25% YoY, lowest since 1972 per Reuters June 11) with Hard Red Winter at 1957 lows, yet market trading at 611 cents following 7% bounce from mid-June 570 lows suggests incomplete pricing of supply shock against global 275.0 MMT stocks creating fundamental-price tension requiring resolution
Putting It Together
In summary, the positioning picture for wheat reflects neutral conviction levels set against a consolidating after bounce market backdrop. Trend strength at 5/10 paints a picture of a market with some direction but lacking strong conviction. The interplay between smart money activity, retail sentiment, and options market signals will shape how this positioning resolves.
Consensus vs Reality
Last Week's Consensus
“Bearish following June 11 WASDE production downgrades with market viewing U.S. supply destruction as insufficient to overcome global stocks-to-use ratio at 45% and weak export demand expecting seasonal June-August harvest pressure to drive prices toward 550-575 support as structural oversupply narrative dominates”
▲
What Actually Happened
+4.57%
584.4 → 611.1
Key Questions Answered
What direction is Wheat likely to move?
Cautiously neutral to mildly bearish following June 11 WASDE rally failure with market viewing advance from 570 to current 611 as technical bounce within structural range expecting seasonal June-August harvest pressure to cap upside near 620 resistance as global oversupply at 275.0 MMT stocks provides structural buffer against U.S. regional drought concerns
What is driving Wheat price this week?
June 11 WASDE (10 days ago) confirmed catastrophic U.S. production collapse to 1,048 million bushels winter wheat (down 25% YoY, lowest since 1972 per Reuters June 11) with Hard Red Winter at 1957 lows, yet market trading at 611 cents following 7% bounce from mid-June 570 lows suggests incomplete pricing of supply shock against global 275.0 MMT stocks creating fundamental-price tension requiring resolution
What is the current volatility regime for Wheat?
Wheat is trading in a high volatility environment, with the 90-day percentile at 68. Realised vol reads 30% (5d), 32.5% (20d), and 27.5% (60d), with the trend stable.
Are there seasonal tendencies for Wheat right now?
Historical seasonal data shows a bullish tendency for Wheat in June 2026 with a 65% win rate. Winter wheat harvest begins, weather-driven.
How are institutions positioned in Wheat?
Managed money at historic net short -79,407 contracts per June 9 COT (reported June 12) representing largest bearish positioning extreme on record since 2006 with 65,103 longs versus 142,696 shorts creating asymmetric short-covering risk if market reprices June 11 WASDE production shock beyond current 611 level yet positioning removes squeeze fuel that characterized prior rallies
This analysis covers one dimension. Our full weekly report combines six specialist agents into a single actionable briefing with directional bias, key levels, and risk-opportunity matrix.