Wheat COT & Institutional Positioning — Smart Money Analysis
Wheat institutional positioning: COT data, sentiment analysis and smart money flow assessment.

Institutional Positioning
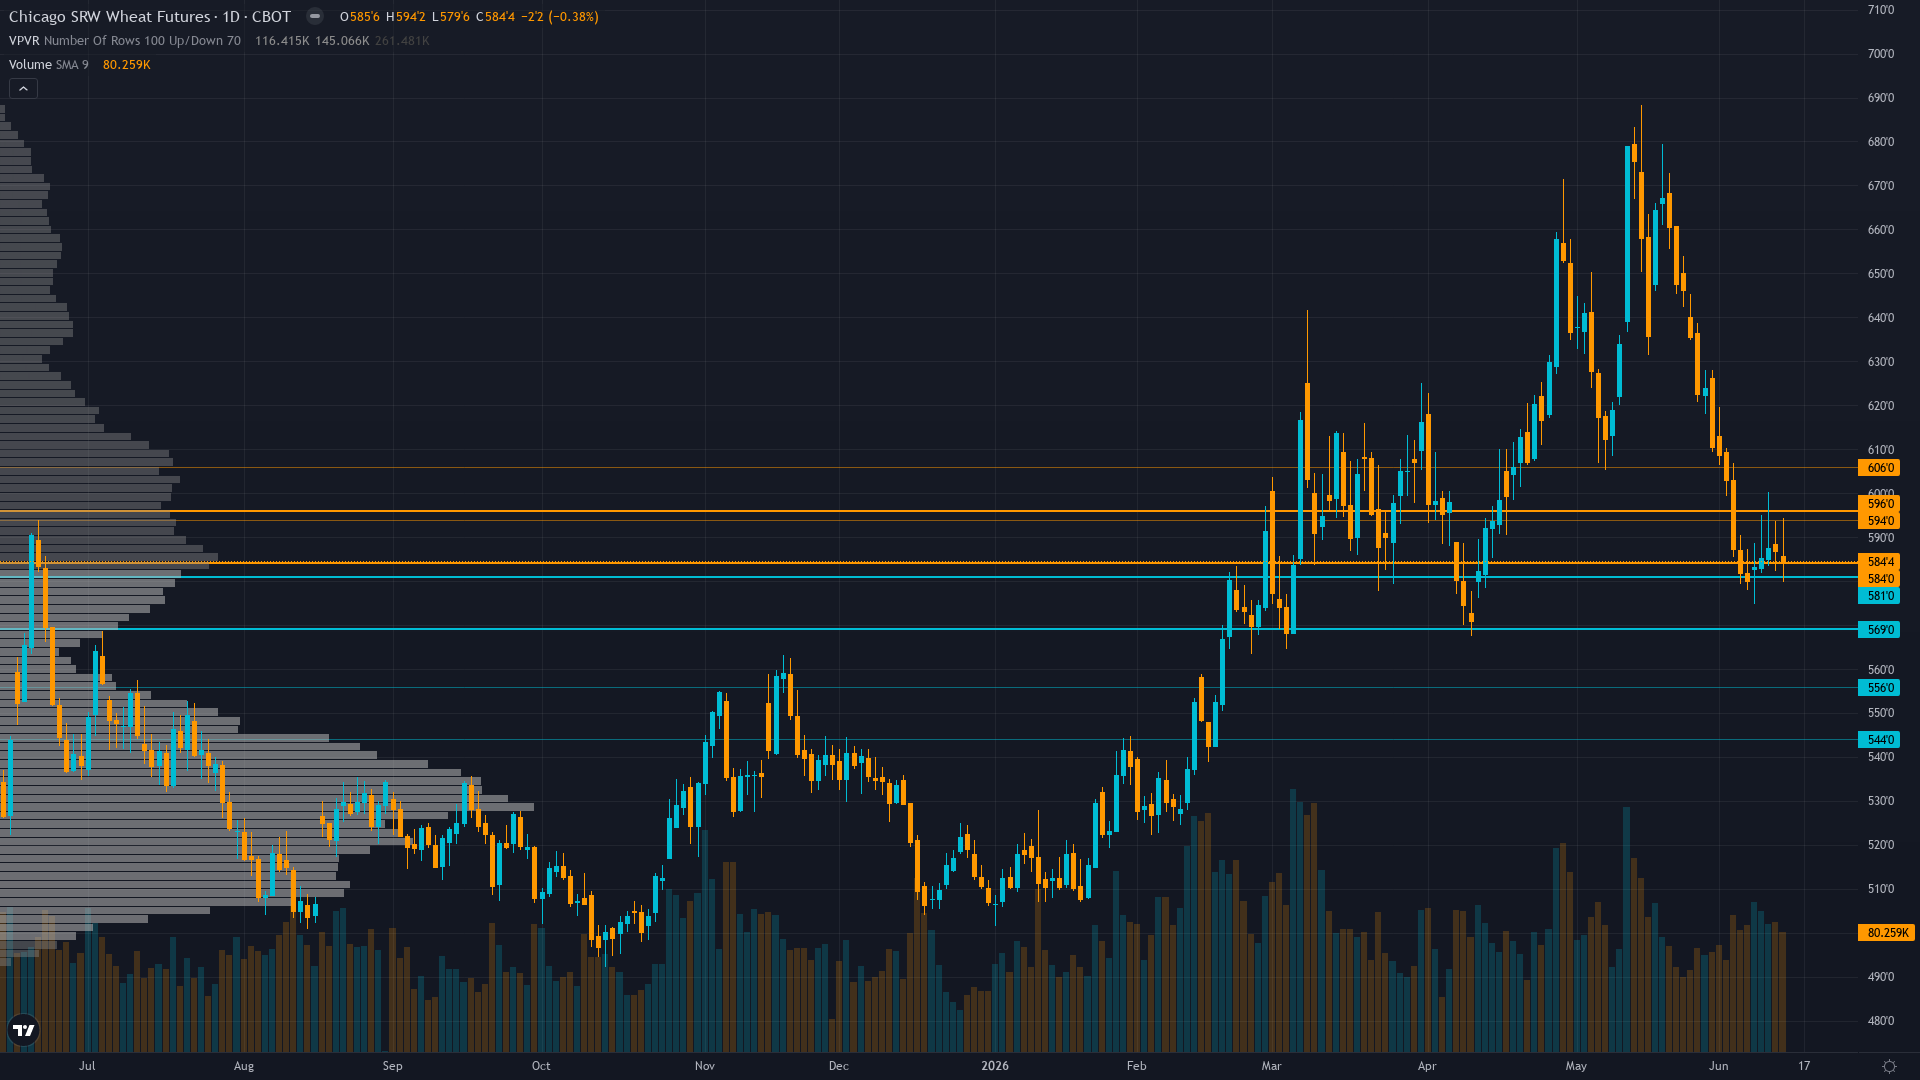
wheat holds at 584.4, off 0.27% in a modest retracement from recent levels.
Managed money net short -77,593 contracts as of June 9 representing extreme bearish positioning (largest on record since 2006) yet this is CONTRARIAN BULLISH signal per Institutional agent as specs maximally short against historically severe production shortfall removing downside fuel and creating asymmetric short-covering risk if market reprices drought damage
Where We Agree & Diverge
Market consensus: Bearish following June 11 WASDE production downgrades with market viewing U.S. supply destruction as insufficient to overcome global stocks-to-use ratio at 45% and weak export demand expecting seasonal June-August harvest pressure to drive prices toward 550-575 support as structural oversupply narrative dominates
Primary driver: June 11 WASDE (released 3 days ago) confirmed 27% YoY production collapse to 1.03 billion bushels (lowest since 1972) with Hard Red Winter at 1957 lows per Reuters, yet market trading at 584 cents suggesting global stocks-to-use ratio of 45% and weak export demand are overwhelming U.S. regional supply destruction in pricing hierarchy creating profound fundamental-price disconnect
Consensus Gaps
Desk sees genuine contrarian opportunity where managed money record net short -77,593 contracts (largest since 2006) against June 11 WASDE production catastrophe (1.03B bushels lowest since 1972, Hard Red Winter at 1957 lows) creates asymmetric short-covering risk market appears to be underpricing, yet acknowledges global 45% stocks-to-use ratio provides structural headwind justifying moderate not extreme divergence score
Sentiment Analysis
Positioning in wheat futures is balanced, with neither bulls nor bears holding a decisive edge. Neutral sentiment typically precedes a directional catalyst.
Derivatives Intelligence
Implied volatility data unavailable for current ZW contracts due to thin agricultural options markets limiting directional signal clarity though historical WASDE-driven volatility patterns suggest elevated two-way risk persists in post-June 11 catalyst repricing phase
Net Assessment
The institutional landscape for wheat price shows neutral sentiment. Trend strength sits at 4/10, reflecting moderate directional pressure without clear dominance. The combination of positioning data, sentiment, and options flow provides context for understanding where smart money is leaning heading into the week.
This analysis covers one dimension. Our full weekly report combines six specialist agents into a single actionable briefing with directional bias, key levels, and risk-opportunity matrix.
Start Free — Get the Market of the WeekFree weekly report · No credit card · Upgrade anytime


