S&P 500 Key Levels This Week — Support, Resistance & Confluence Zones
S&P 500 key levels breakdown: support zones, resistance zones, confluence and price structure.

Price Architecture
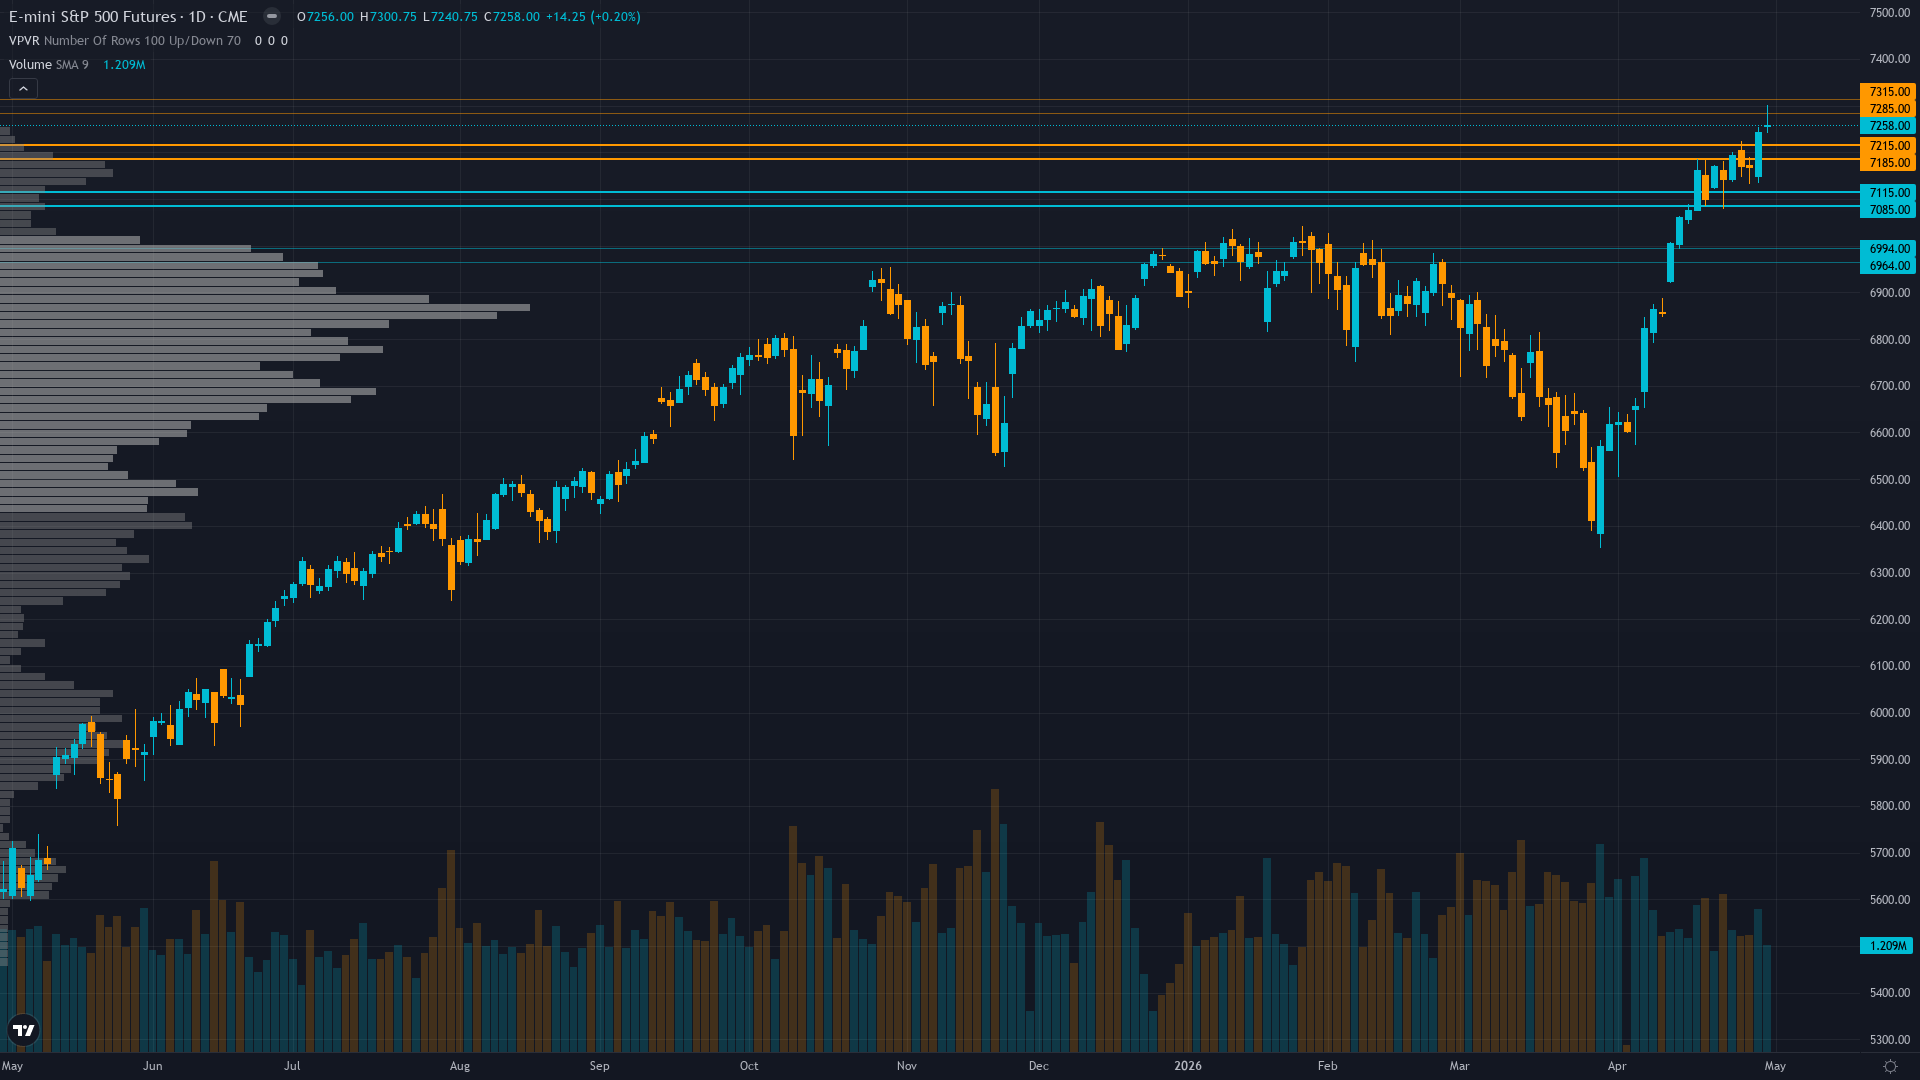
S&P 500 sits at 7258 after a 0.20% gain — a quiet move higher without aggressive momentum. S&P 500 futures is in a trending up market state, requiring careful assessment of current conditions.
Strong uptrend with ES at 7,258 well above 50-day MA 7,158 (+1.4%) and 200-day MA 6,851 (+5.9%), RSI 69.17 approaching overbought 70 threshold after testing 7,300.75 intraday resistance, volume 1.21M confirming recent upside moves
Trend strength is elevated at 8/10, indicating strong directional conviction in current price action.
Downside Protection
The downside architecture for S&P index features support zones rooted in prior buying activity. These are not arbitrary lines but areas where real capital has previously been committed.
The reliability of support under trending up conditions is shaped by the interplay between volatility regime and historical volume at each level.
Resistance Zone Context
The upside path for ES futures is marked by resistance zones where prior selling activity created structural barriers. Clearing these zones requires either strong momentum or a shift in the fundamental picture.
In the current market state, resistance zones remain key decision points.
Analytical Convergence
The most actionable levels for S&P 500 are those where multiple analytical disciplines converge. When technical structure, institutional positioning, and options flow all point to the same zone, the probability of price reacting there increases meaningfully.
Normal volatility regime suggests 1.0-1.5% daily ES moves expected with current 7,240-7,300 consolidation representing 0.8% range - May 7 FOMC binary outcome presents asymmetric expansion risk with potential 2-3% intraday swings on Powell rhetoric surprise either direction
Our Multi-Agent Approach to Key Levels
The levels in our paid reports are generated by six specialist agents working in parallel. Technical analysis provides the structural framework, institutional data shows where capital is committed, options flow reveals hedging behaviour, fundamentals anchor levels to value, sentiment gauges crowd positioning, and economic analysis times the catalysts.
The output is a curated set of levels with institutional-grade validation — the kind of multi-dimensional analysis that hedge fund research desks produce, delivered at a fraction of the cost.
Our paid reports include specific support and resistance levels identified by six specialist agents — technical structure, institutional positioning, options flow, fundamentals, sentiment, and economic analysis. Not just lines on a chart, but zones validated by multi-discipline confluence.
Start Free — Get the Market of the WeekFree weekly report · No credit card · Upgrade anytime


