S&P 500 Forecast This Week — Outlook, Drivers & Key Levels
This week's S&P 500 outlook: key drivers, volatility context, risk-opportunity assessment and the week ahead.

Where Things Stand
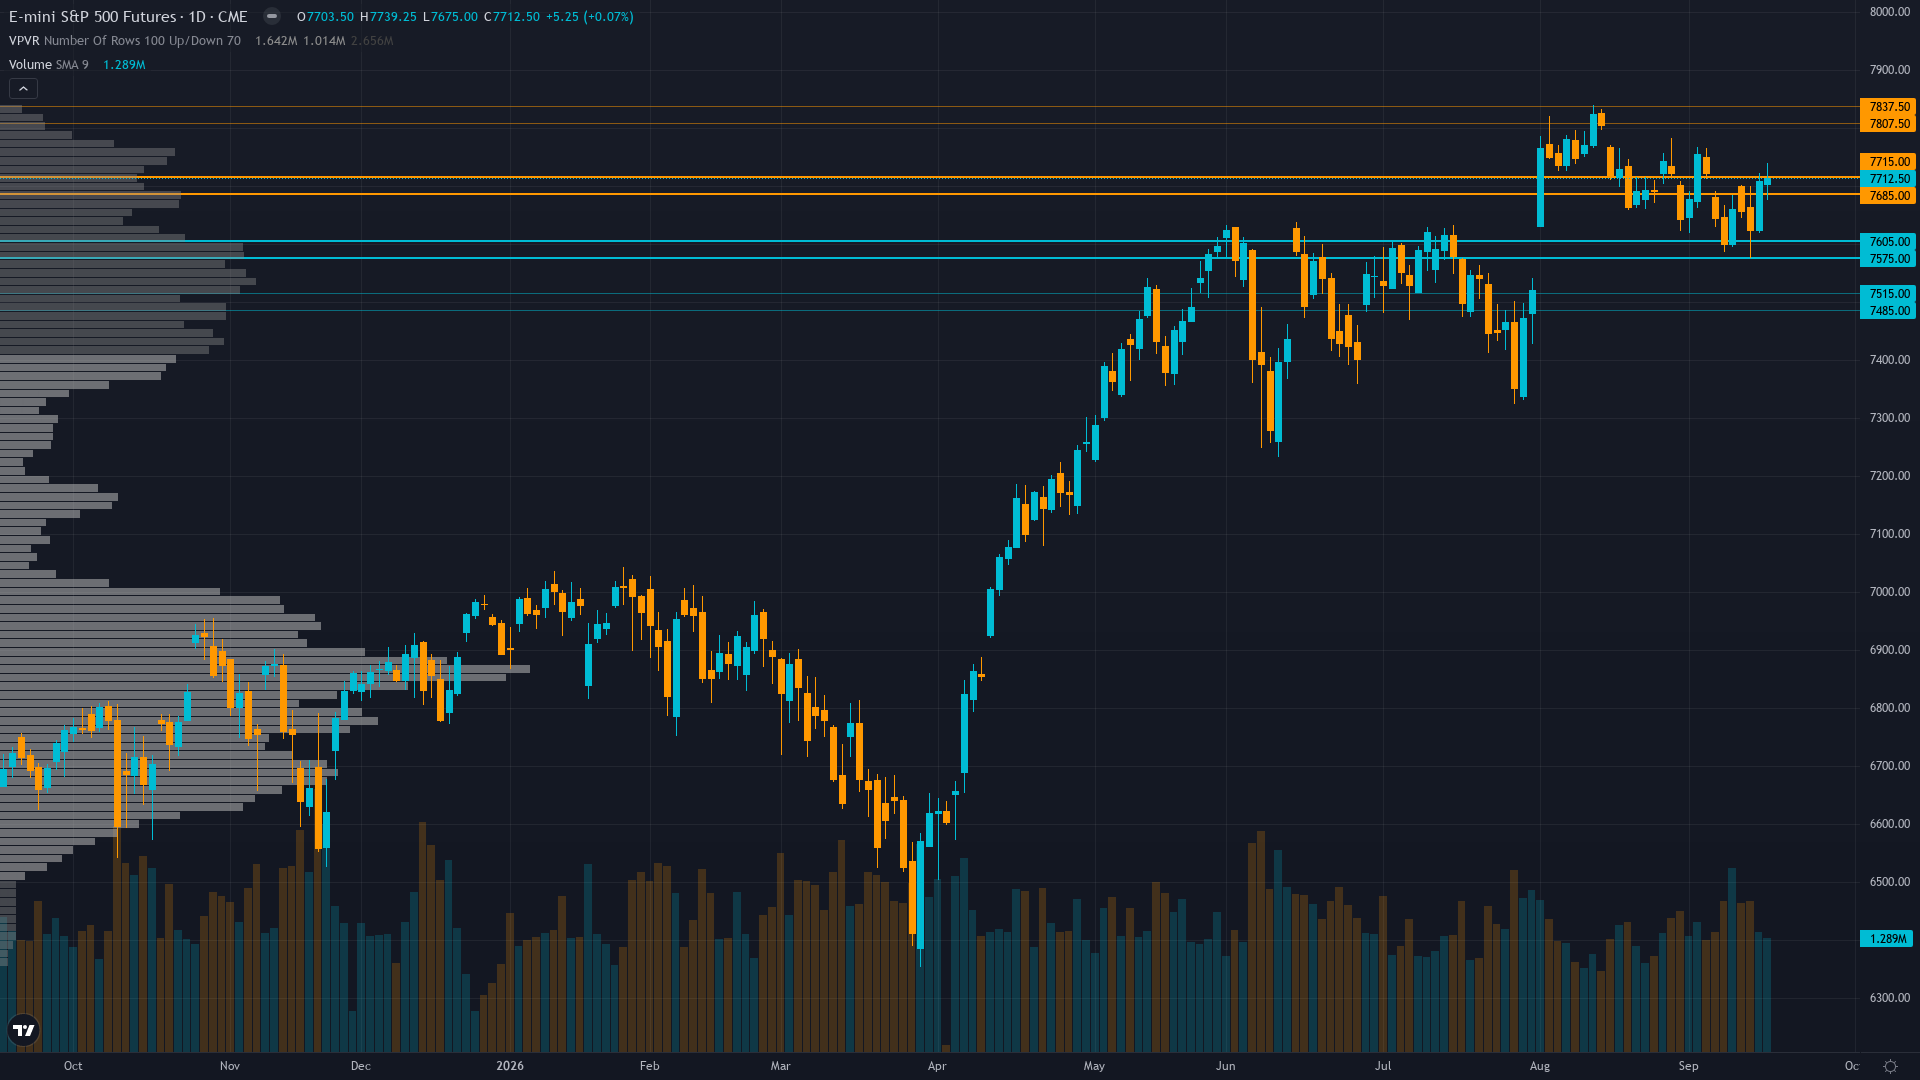
S&P 500 is trading at 7657.35, down 0.07% in a measured pullback. S&P 500 futures is consolidating, with price compressing into a narrower range as the market builds energy for its next move.
Cautiously neutral as S&P 500 holds near 7,650 despite 5% 10-year yields and extreme breadth contraction, with market awaiting PMI data and Fed guidance this week for directional catalyst
What's Driving Price
Primary driver: ES consolidates at 7,657 after a near-flat week (-0.03%) as the S&P 500 cash index closed mixed on Sept 18 triple witching with the 10-year yield reaching 5.01% and extreme breadth contraction (only 119 of 500 stocks advancing), yet the VIX compressed to 14.81 and AAII bearish sentiment surged to 53.3% creating contrarian bullish setup for the week ahead
Secondary factor: CFTC COT data Sept 15 shows non-commercial net short at -100,461 contracts (43rd percentile) after a -24,425 contract reduction in bearish bets — speculative shorts are unwinding into weakness, suggesting institutional position squaring ahead of quarter-end, but the net short remains at moderate levels limiting short-squeeze asymmetry
Additional influence: 10-year yield breached 5.01% on Sept 18 (up 5bp on the week) marking the highest level in 19 years per CNBC Sept 14 reporting — the yield surge is compressing equity risk premia and weighing on growth stock valuations, but has not triggered a systemic equity selloff, suggesting the market is gradually absorbing higher rates as a reflection of growth rather than inflation panic
Economic backdrop: Fed funds at 3.63% (Aug), inflation stable at 2.33%, unemployment 4.1%, retail sales $668.9B (up 1.2% MoM); S&P Global PMIs due Sept 23 provide next macroeconomic catalyst; multiple Fed speeches scheduled this week (Goolsbee Sept 21, Williams/Jefferson/Barkin Sept 22, Barr Sept 23)
Fundamental assessment: Forward P/E ~19.3x on $397.02 forward EPS slightly above historical averages but supported by 24-28% earnings growth projections for 2026; Q3 earnings season begins October as next fundamental validation point
Chart Assessment
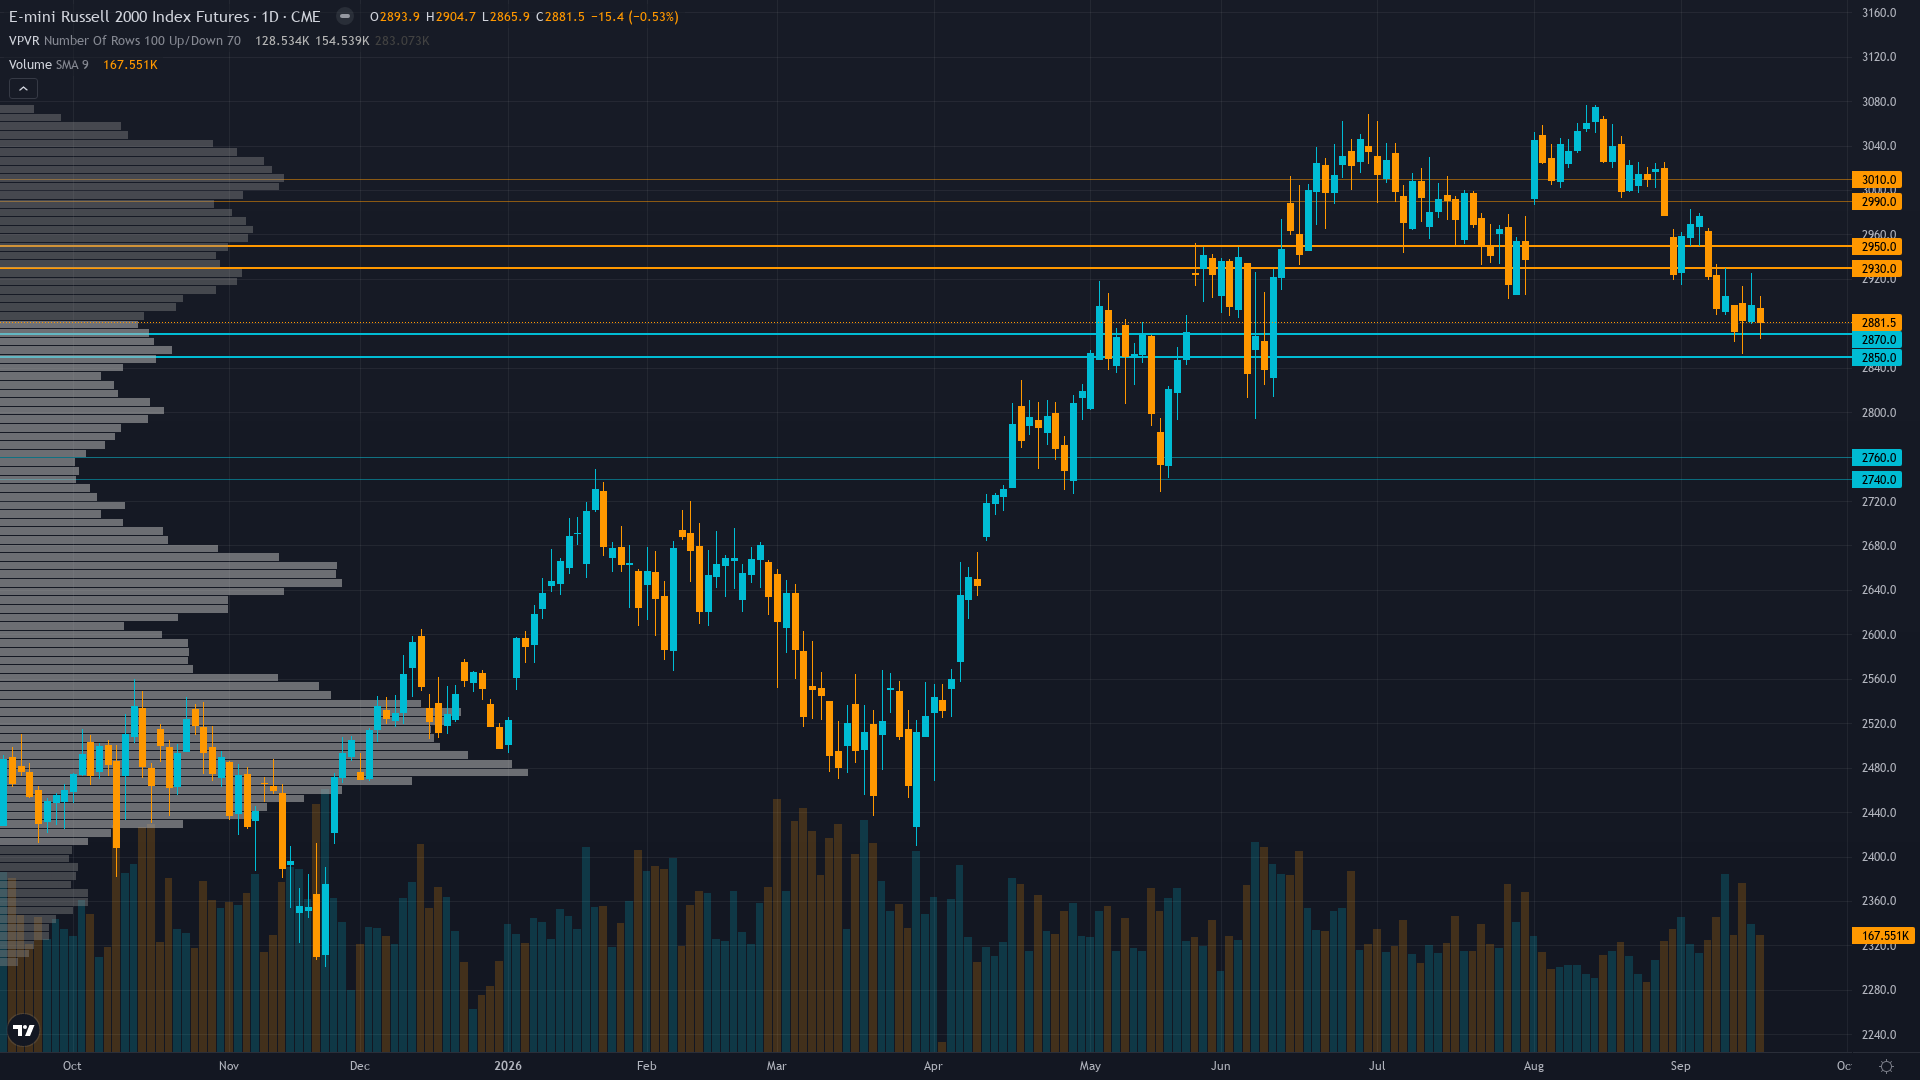
Daily trend neutral-to-slightly-bearish with ES at 7,657 below 52-week high of 7,822.5 but holding in upper 88.5% of annual range; RSI likely 40-60 neutral zone; 7,580-7,620 institutional support zone tested and held; consolidation beneath 7,703 VAH resistance with no breakout catalyst
With trend strength at only 3/10, any directional bias is thin and easily disrupted.
Volatility Context
At the 18th percentile, ES futures volatility is unusually subdued, creating conditions that historically precede sharp directional moves. Realised vol is declining steadily, compressing into ranges that tend to snap when a catalyst breaks the equilibrium.
Low volatility regime suggests 0.5-0.9% daily ES moves (~38-69 points) with 20-day realised vol at 8.9% pricing sub-0.6% one-standard-deviation daily moves. The Sept 21-23 Fed/PMI catalyst cluster creates potential for 1.5-2.5% directional expansion on policy surprises. Support 7,580-7,620 and resistance 7,700-7,703 define the consolidation zone, with 7,500 major support and 7,822.5 ATH framing the broader range
Upside & Downside
Primary risk: 10-year yield sustained above 5.00% continues compressing equity risk premia and could trigger multiple compression for growth stocks, particularly if Fed speeches this week reinforce hawkish higher-for-longer messaging, driving ES below 7,580 support toward 7,500 major support (Probability: medium)
Primary opportunity: AAII bearish sentiment at 53.3% (16-month high) and VIX compression to 14.81 create contrarian setup — any positive catalyst from Fed speeches or PMI data (Sept 23) could trigger short-covering rally from -100,461 net short speculative position back toward 7,700-7,800 (Timeframe: September 21-25 2026)
This week's edge: Signal below Min Signal threshold — directional edge insufficient for bias. The market may be underweighting the contrarian significance of AAII bearish sentiment at 53.3% (16-month high) combined with VIX compression to 14.81 and speculative short covering of -24,425 contracts, while simultaneously over-extrapolating the 10-year yield breach of 5% as a negative equity catalyst when the contained 3-month return (+1.98%) suggests markets are pricing higher rates as a growth validation rather than inflation concern
The Week Ahead
The Fed Goolsbee Speech — first of four Fed speaker events this week providing policy guidance after 10Y breached 5% on Monday 21 September represents a mid-tier catalyst that could accelerate or stall the current directional thesis.
How S&P 500 navigates the confluence of consolidating conditions and incoming data will determine whether the current directional thesis holds or breaks.
This analysis covers one dimension. Our full weekly report combines six specialist agents into a single actionable briefing with directional bias, key levels, and risk-opportunity matrix.
Start Free — Get the Market of the WeekFree weekly report · No credit card · Upgrade anytime