Russell 2000 Forecast This Week — Outlook, Drivers & Key Levels
This week's Russell 2000 outlook: key drivers, volatility context, risk-opportunity assessment and the week ahead.

Current Market Picture
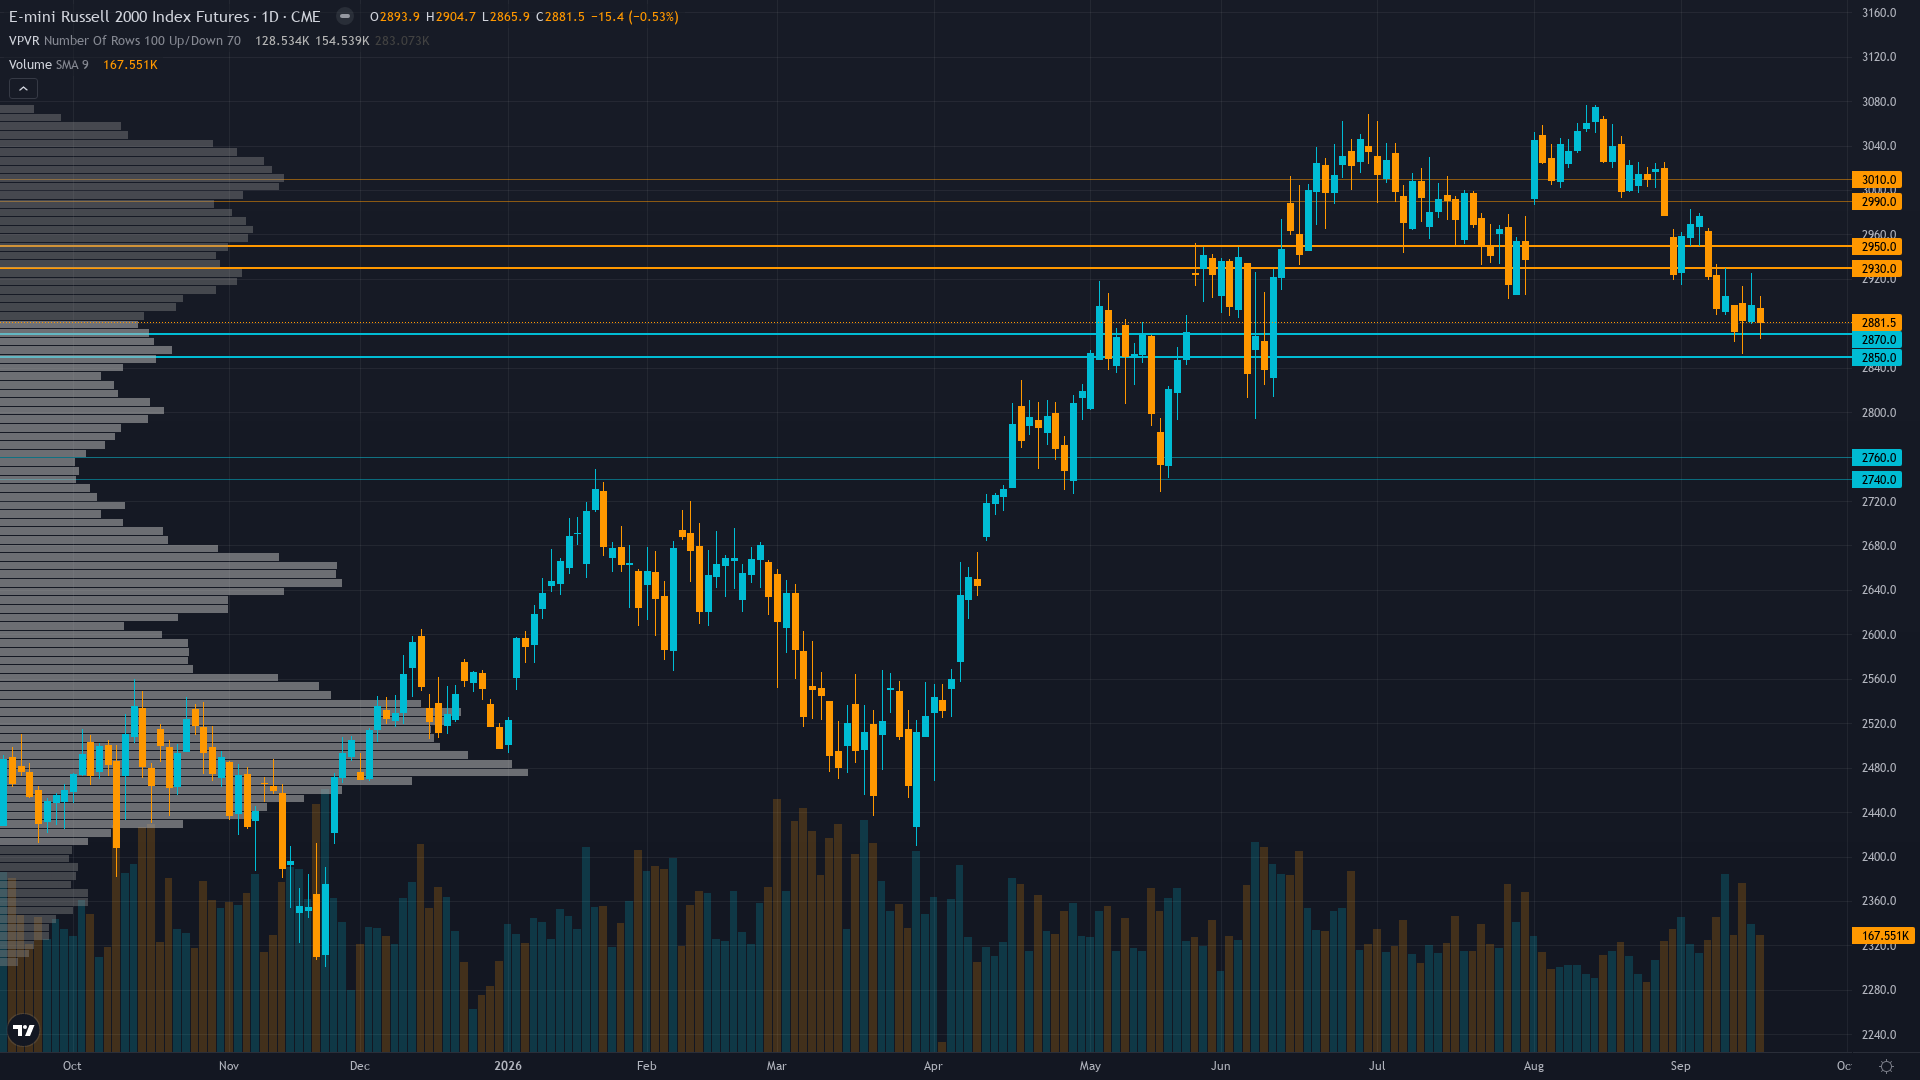
At 2873.23, Russell 2000 has eased 0.53% in a controlled retreat. Russell 2000 futures is in a breaking down market state, requiring careful assessment of current conditions.
Small-caps in an accelerating downtrend with sustained breakdown below 2,900, driven by rising rates and slowing PMI expectations, though extreme speculative short positioning at 5.7th percentile creates latent squeeze risk that early covering activity has not yet resolved
Risk & Opportunity
Primary risk: Further technical breakdown below 2,860 immediate support accelerating toward 2,700-2,800 as rising 10Y yields at 5.01% and hawkish rate repricing (markets pricing 4.2% by Dec 2026) compound the credit-sensitive small-cap headwind, with the 5.7th percentile COT positioning being insufficient to prevent further decline if fundamental selling pressure overwhelms early short-covering dynamics — the September seasonal headwind historically produces negative average returns for RTY, with the index already down -6.6% from its Aug 14 ATH and showing no signs of stabilization (Probability: high)
Primary opportunity: A PMI upside surprise on Sep 23 combined with the extreme speculative net short at -72,350 contracts (5.7th percentile) could trigger a violent short-covering rally from deeply oversold RSI at 33.7, targeting a retest of 2,900-2,940 resistance — with shorts having already begun covering (10,485 contracts reduced last week), the setup for a squeeze is mathematically primed, and the 52-week range position at 73.6% suggests further downside is not without valuation support from the 34% discount to large caps (Timeframe: 1-2 weeks through Sep 23 PMI catalyst resolution and into late September)
This week's edge: The market consensus is pricing a linear continuation of the small-cap selloff driven by rising yields and slowing economic momentum, but may be underappreciating that the 12.6% week-over-week reduction in speculative net shorts (from -82,835 to -72,350 contracts) signals the squeeze setup is beginning to activate — the fact that shorts are covering while price is still declining means the setup is building for a violent reversal when the first positive catalyst emerges, though the desk recognizes that current fundamental headwinds (5.01% 10Y, hawkish Fed repricing, deteriorating PMI, September seasonality) are powerful enough that fading the downtrend remains high-risk without a specific catalyst trigger, making this a measured bearish continuation call rather than an aggressive short
What's Driving Price
Primary driver: Sustained technical breakdown below 2900 psychological support with RTY down -5.48% in 1M and -1.08% in the past week alone, driven by rising 10Y Treasury yields at 5.01% (highest since late August, +5bp in 1W) creating acute headwinds for credit-sensitive small-cap balance sheets carrying floating-rate debt — the 2s10s curve at +25bp confirms the normalizing yield environment that is structurally negative for RTY as a credit instrument per Section 3 asset-specific context
Secondary factor: CFTC COT data as of 2026-09-15 shows non-commercial speculators net short -72,350 contracts (5.7th percentile of 3-year range, -14.6% of OI), still at extreme bearish levels but having reduced shorts by 10,485 contracts (12.6% reduction) week-over-week — early short-covering is underway but positioning remains historically skewed bearish at the 5.7th percentile, suggesting potential for further squeeze dynamics if positive catalyst emerges, though the ongoing price decline to new lows indicates fundamental selling pressure is overwhelming covering activity
Additional influence: Upcoming S&P Global PMI data on 2026-09-23 (Manufacturing est 53.6 vs prior 53.9, Services est 56.0 vs prior 56.5, Composite est 55.2 vs prior 56.0) represents the dominant near-term catalyst — all three readings are expected to decline modestly, which would confirm slowing economic momentum that is disproportionately negative for domestically-focused small-cap earnings, while any upside surprise could trigger violent short-covering from the still-extreme speculative net short positioning of -72,350 contracts
Economic backdrop: TRANSITIONAL leaning RISK-OFF: Fed funds at 3.63% with markets pricing rate hikes to 4.2% by Dec 2026, 10Y yield at 5.01% (+5bp in 1W), HY credit spreads at 276bp (Sep 15) stable but elevated from Q1 tights, inflation at 2.33% still above 2% target, unemployment at 4.1%, consumer sentiment at 55.2 (depressed) — the combination of rising yields and weak consumer confidence is uniquely problematic for domestic-demand-driven small-cap earnings
Fundamental assessment: Forward P/E of approximately 19.9x-25.4x represents a 15-20% premium to historical fair value (15-17x), with consensus projecting 43% YoY small-cap earnings growth that faces elevated delivery risk given rising rate headwinds and slowing economic momentum — the earnings bar is high and the probability of disappointment is rising as 10Y yields at 5.01% compress valuations
Chart Assessment
Confirmed bearish downtrend with price at 2,873 trading decisively below both the 50-day MA (2,492) and 200-day MA (2,564), RSI at 33.7 in oversold territory, MACD negative at -11.97 confirming momentum, having broken below 2,900 psychological support in the week ending Sep 18 — the index has printed lower highs and lower lows since the Aug 14 ATH at 3,074.9, now -6.6% from that peak and -11.1% from the June 25 record, with the 2,860 recent daily low as the last support before a potential move toward 2,800 major support
With trend strength at 7/10, there's a clear directional tilt but room for the move to develop further.
Volatility Context
At the 62th percentile, RTY futures volatility sits in a normal range, neither compressed enough to signal a breakout nor elevated enough to demand caution. Realised vol is trending higher across the curve, which tends to accompany transitional periods where the market is repricing risk.
Normal volatility regime at 62nd percentile with inverted term structure requires wider stop placement near 2,800 major support, expect 50-80 point daily ranges expanding to 80-100 on Sep 23 PMI release day, the inverted term structure and extreme net short positioning signal catalyst-dependent binary outcome — range-trading between 2,860-2,900 with defined boundaries preferred until PMI data provides directional clarity, though the breakdown below 2,900 favors downside positioning with tighter stops
Seasonal Patterns
The seasonal picture for small-cap futures turns negative in September 2026 (40% win rate). September is historically weakest month.
Looking Forward
All eyes turn to S&P Global Composite PMI (Sep) — consensus 55.2 vs prior 56.0; Manufacturing PMI consensus 53.6 vs prior 53.9; Services PMI consensus 56.0 vs prior 56.5 — all expected to decline, providing the next test of small-cap domestic demand trajectory on Wednesday 23 September, which carries enough weight to force a decisive directional move.
The week ahead for RTY futures hinges on whether the prevailing breaking down regime can absorb the scheduled catalysts without a regime shift.
This analysis covers one dimension. Our full weekly report combines six specialist agents into a single actionable briefing with directional bias, key levels, and risk-opportunity matrix.
Start Free — Get the Market of the WeekFree weekly report · No credit card · Upgrade anytime