S&P 500 Forecast This Week — Outlook, Drivers & Key Levels
This week's S&P 500 outlook: key drivers, volatility context, risk-opportunity assessment and the week ahead.

Where Things Stand
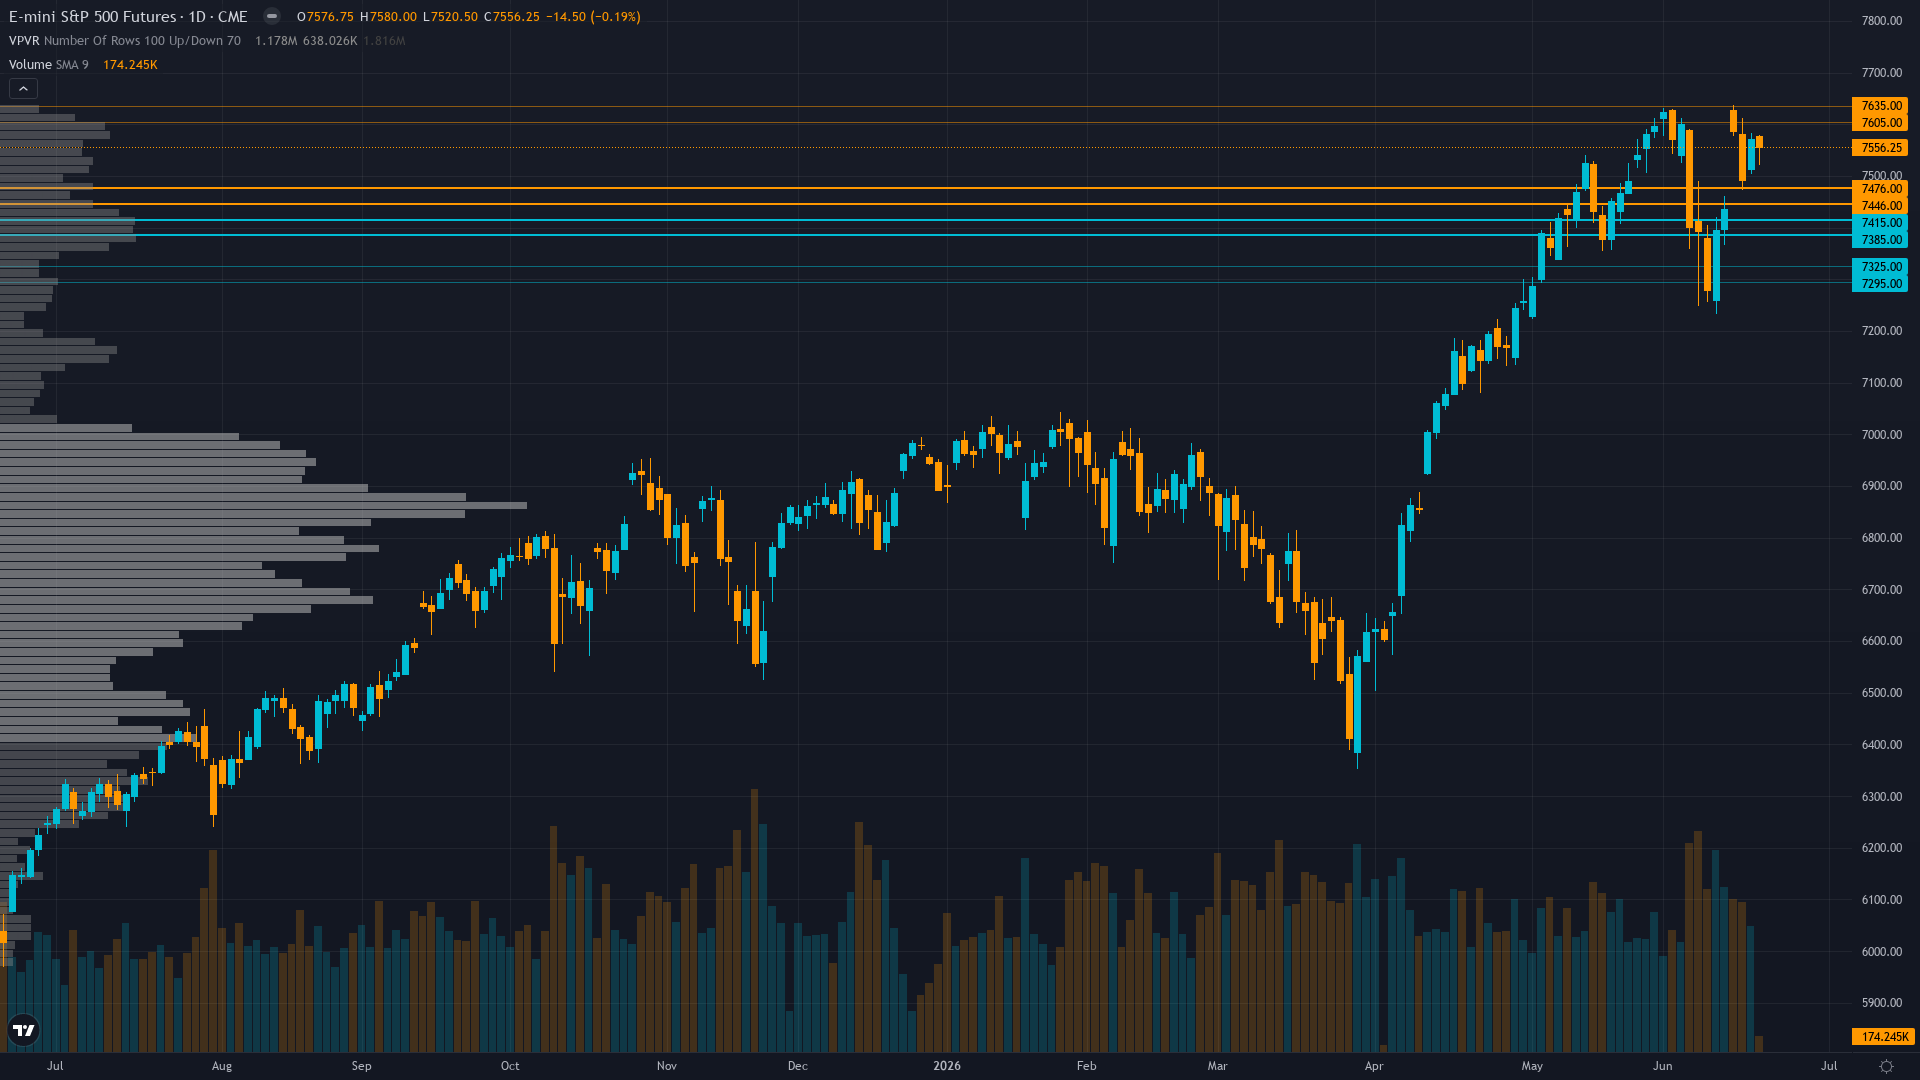
Trading at 7556 with a 0.19% dip, S&P 500 is giving back ground gradually. S&P 500 futures is in a trending up market state, requiring careful assessment of current conditions.
Divided between consolidation in 7,500-7,600 range absorbing quarter-end flows and modest pullback toward 7,448-7,400 testing 50-day MA support, with majority positioning cautiously ahead of June 30 mechanical rebalancing then turning optimistic for post-quarter-end relief rally
What's Driving Price
Primary driver: Quarter-end rebalancing calendar convergence creates mechanical headwind - JPMorgan estimates $165B global equity selling from pensions/sovereign wealth funds over next 9 days into June 30, with $60B from Japan GPIF and $40B from Norway, overwhelming June 17 FOMC neutral outcome where Warsh held rates but raised dot plot creating hawkish tilt
Secondary factor: Post-June 20 quadruple witching ($8.3T notional, largest in history per Citadel) gamma unwind removes options market support structure as VIX compressed to 16.78 (-23% from prior week's 21.51) shows complacency developing despite mechanical selling pressure ahead
Additional influence: Technical structure intact with ES at 7,556 above 50-day MA 7,448 and 200-day MA 7,467 but RSI 52.35 neutral momentum after testing 7,568 intraday high creates consolidation bias as institutional positioning shows -2.0 bearish flow signal from calendar-driven rebalancing
Economic backdrop: Fed held 3.50-3.75% at June 17 FOMC but Warsh raised dot plot projections creating hawkish tilt, May CPI 4.17% YoY validates sticky inflation (more than double 2% target), ISM Manufacturing 54.0 expansion supports soft landing but higher-for-longer rates
Fundamental assessment: Forward PE 21.0-22.5x at fair value justified by Q1 2026 earnings growth 21.3% with record margins, but no fresh catalyst since May 8 FactSet update (6 weeks stale) as Q2 earnings season approaches mid-July creating execution risk
Chart Assessment
Uptrend holding - ES 7,556 above 50-day MA 7,448 (+2.3%) and 200-day MA 7,467 (+1.9%) with RSI 52.35 neutral after testing 7,568 resistance, confirming consolidation near all-time highs without breakdown but lacking breakout momentum
With trend strength at 7/10, there's a clear directional tilt but room for the move to develop further.
Risk & Opportunity
Primary risk: June 30 quarter-end mechanical selling ($165B estimated by JPMorgan) intensifies if any negative catalyst emerges while put/call 0.59 complacency positioning unwinds violently, testing 7,500 then 7,448 50-day MA support as VIX re-expands above 18 (Probability: medium)
Primary opportunity: Post-June 30 rebalancing relief rally toward 7,650-7,750 psychological resistance if mechanical selling pressure concludes without triggering systematic deleveraging and Q2 earnings season (begins early July) validates 21%+ growth expectations enabling VIX compression below 16 (Timeframe: July 1-15 2026)
This week's edge: Market may be underestimating persistence of quarter-end mechanical selling pressure from $165B global rebalancing over 9-day window creating near-term consolidation-to-modest-pullback bias while overestimating ability to grind higher through calendar headwinds - JPMorgan's specific flow estimates suggest forced selling regardless of fundamentals that consensus dismisses
Volatility Backdrop
ES futures volatility at the 48th percentile reflects a balanced environment where standard risk parameters apply. Volatility remains anchored at current levels, with no clear signal of an imminent regime shift in either direction.
Normal volatility regime suggests 1.0-1.5% daily ES moves expected with current 7,537-7,568 consolidation representing 0.4% range - June 30 quarter-end mechanical flows present asymmetric risk with potential 2-3% intraday swings if systematic deleveraging triggers versus continued compression
The Week Ahead
Quarter-end rebalancing window culminates June 30 with estimated $165B global equity selling from pensions and sovereign wealth funds creating mechanical downward pressure regardless of fundamentals, then Q2 earnings season begins early-to-mid July on Tuesday 30 June is a high-impact catalyst with the potential to redefine the near-term outlook entirely.
How S&P 500 navigates the confluence of trending up conditions and incoming data will determine whether the current directional thesis holds or breaks.
This analysis covers one dimension. Our full weekly report combines six specialist agents into a single actionable briefing with directional bias, key levels, and risk-opportunity matrix.
Start Free — Get the Market of the WeekFree weekly report · No credit card · Upgrade anytime