S&P 500 Forecast This Week — Outlook, Drivers & Key Levels
This week's S&P 500 outlook: key drivers, volatility context, risk-opportunity assessment and the week ahead.

Where Things Stand
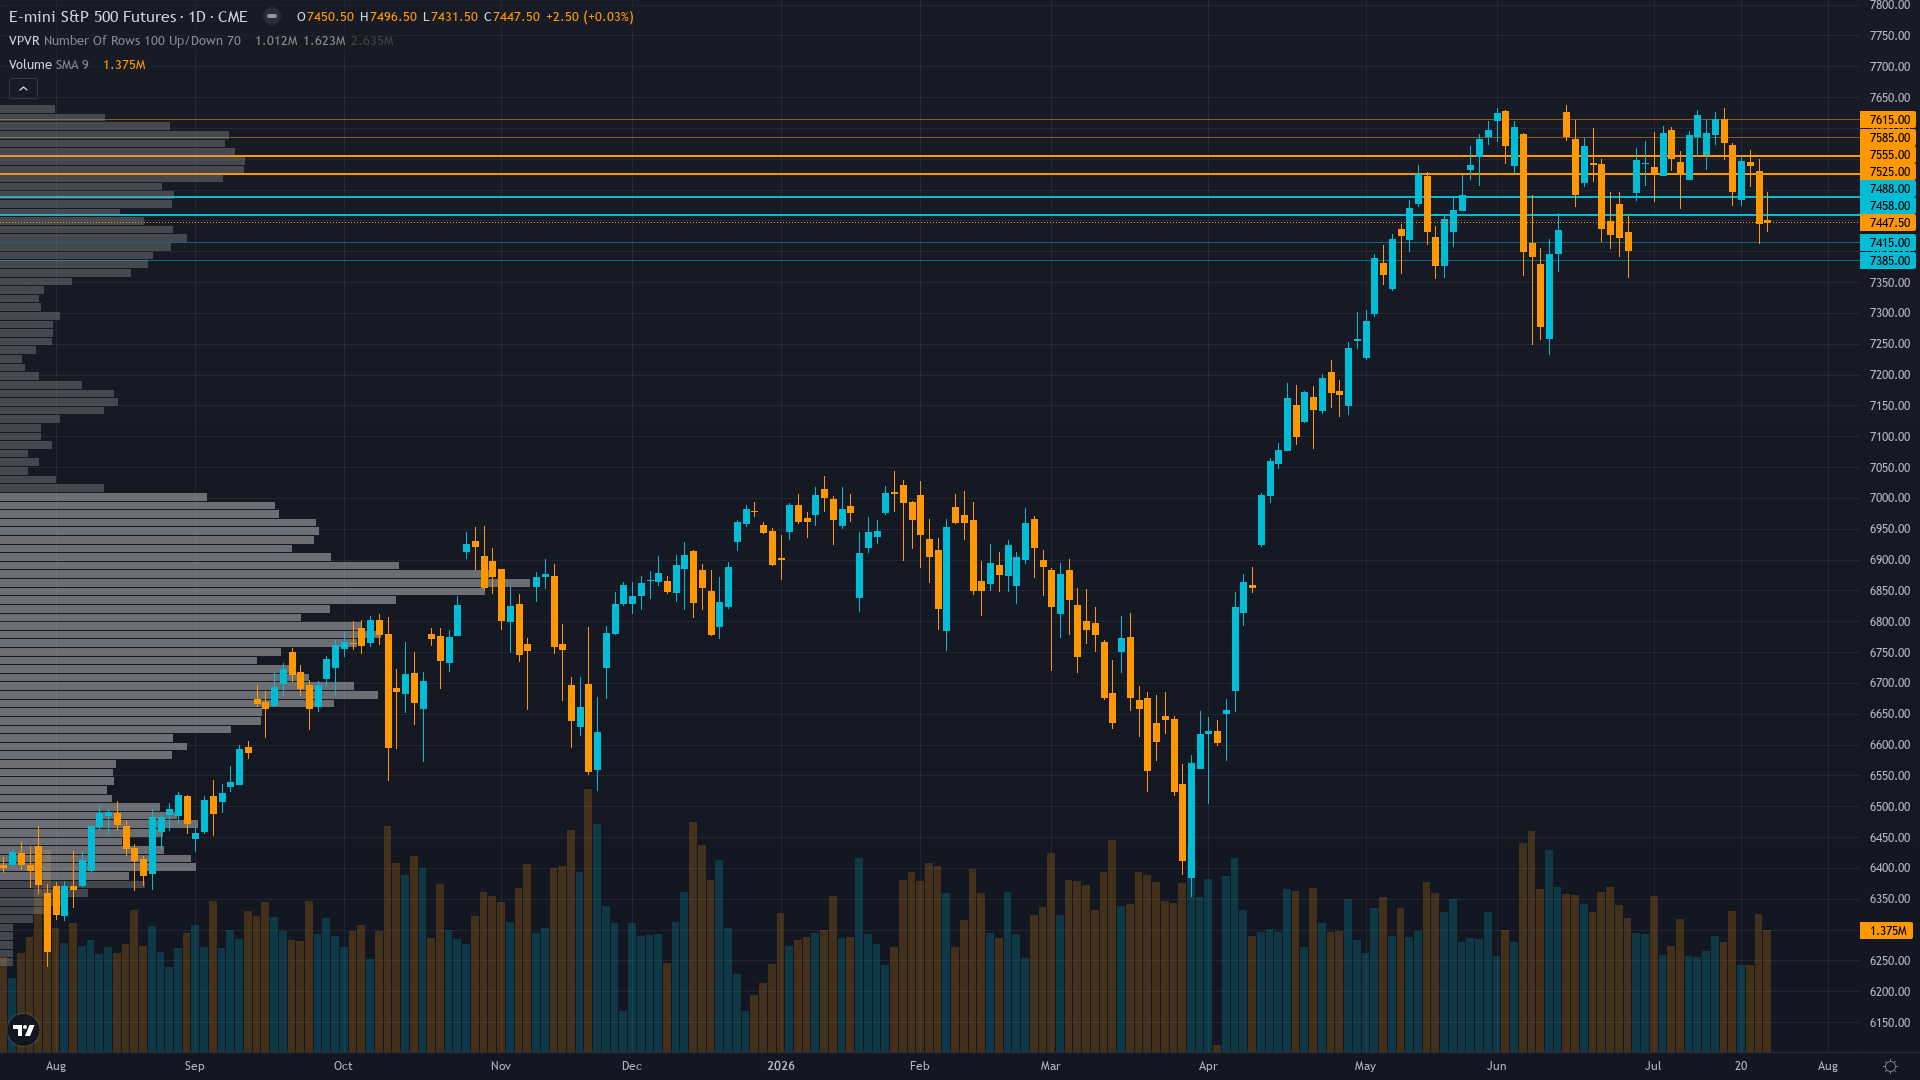
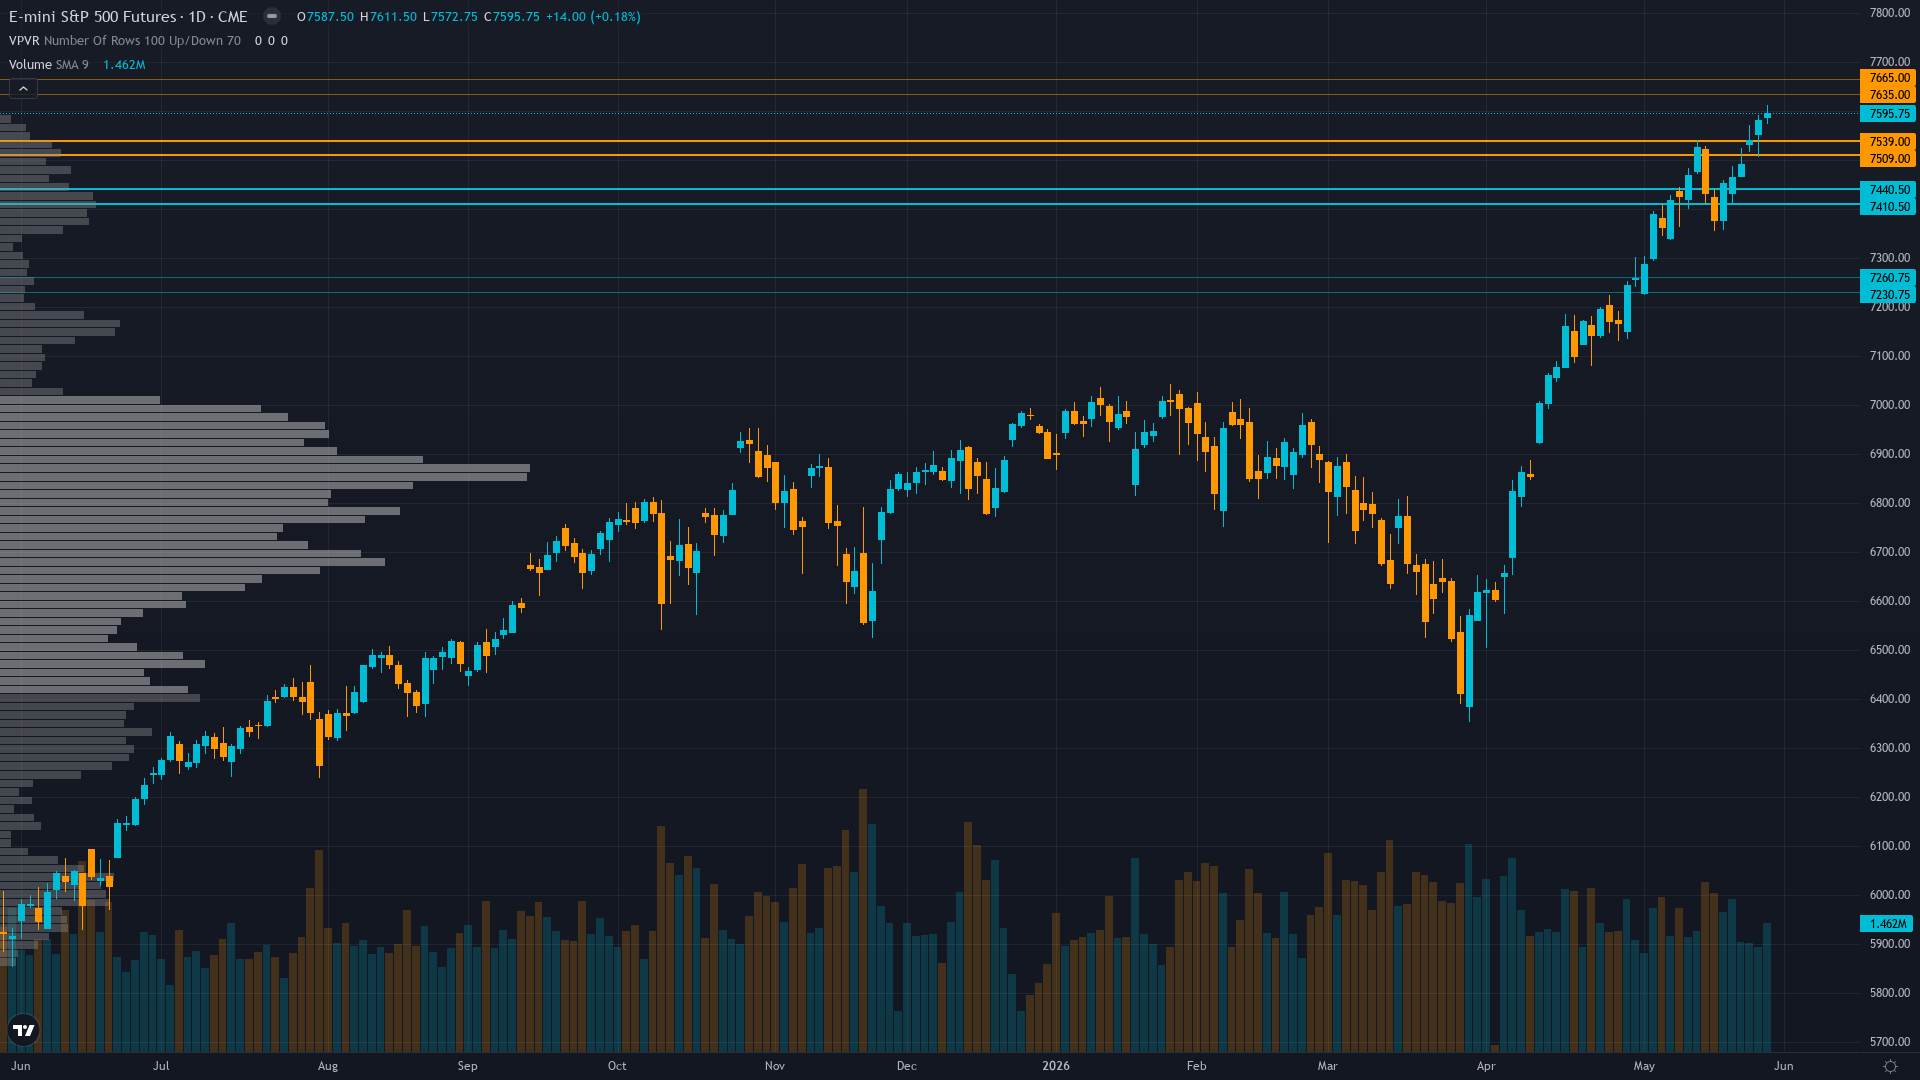
S&P 500 sits at 7595.75 after a 0.18% gain — a quiet move higher without aggressive momentum. S&P 500 futures is in a trending up market state, requiring careful assessment of current conditions.
Cautiously bullish on Q1 earnings strength and technical momentum into June FOMC but increasingly aware extreme put/call 0.39 complacency and 5-week bias streak create asymmetric downside risk if Fed delivers hawkish surprise
What's Driving Price
Primary driver: ES consolidates at fresh all-time highs of 7,595.75 (May 31, 2026) after five consecutive BULLISH weeks delivering +5.81% cumulative gain, as Q1 2026 earnings season validated exceptional 21% YoY growth with 89% of S&P 500 reported, yet extreme positioning with equity put/call ratio 0.39 (approximately 2.6 calls per put) and VIX compressed to 15.32 creates structural reversal vulnerability approaching June 16-17 FOMC catalyst
Secondary factor: Bias streak integrity check required: 5 consecutive BULLISH weeks exceeds ES 3-week review threshold, triggering Thesis Health Score calculation revealing zero contrary weeks in last 4, net +5.81% cumulative confirming move, but extreme complacency at put/call 0.39 and RSI 63.23 approaching overbought creates decay penalty reducing conviction from initial 7 to final 6
Additional influence: Calendar dynamics critical: today May 31 marks month-end creating window-dressing flows, while June 30 quarter-end arrives in 30 days triggering 2-week rebalancing window beginning June 16—precisely coinciding with FOMC meeting date creating dual mechanical and policy catalyst convergence
Economic backdrop: Fed at 3.50-3.75% after April 28-29 hold with zero cuts priced through June 16-17 FOMC, HY OAS 272 bps historically tight confirming risk appetite, ISM Manufacturing 54.0 expansion validates soft landing, but policy vacuum persists ahead of June meeting representing next binary catalyst
Fundamental assessment: Forward PE 20.9-21.0x at modest 5.5% premium to 5-year average but justified by exceptional Q1 2026 earnings growth of 21% YoY (89% of S&P 500 reported as of May 8) with record net margins, full-year 2026 growth projections 21-22.6% validate stretched multiples if execution continues
Chart Assessment
Strong uptrend intact—ES at 7,595.75 decisively above 50-day MA 7,433.36 (+2.2%) and 200-day MA 7,276.11 (+4.4%) with both positively sloped, RSI 63.23 healthy bullish momentum without overbought yet, fresh ATH at 7,611.50 intraday confirming breakout structure continuation
Trend strength registers 8/10 — a reading that suggests the directional impulse has real staying power.
Risk & Opportunity
Primary risk: June 16-17 FOMC delivers hawkish hold maintaining restrictive stance or removing accommodative bias language, triggering equity repricing from forward PE 20.9-21.0x elevated levels as extreme equity put/call 0.39 complacency unwinds violently testing 7,537 immediate support then 7,433 major support (Probability: medium)
Primary opportunity: Sustained breakout above 7,611.50 intraday high toward 7,650-7,750 psychological resistance zone if June 16-17 FOMC maintains accommodative bias AND Q2 earnings season validates 21% growth trajectory enabling VIX compression below 15 with June-July seasonal strength materializing (Timeframe: June 1-30 2026)
This week's edge: Market may be underestimating significance of extreme positioning at put/call 0.39 (2.6 calls per put) combined with VIX 15.32 compression creating structural vulnerability to rapid mean-reversion on any negative catalyst, while overestimating June 16-17 FOMC dovish surprise probability given Fed has maintained restrictive stance consistently—5-week bullish consensus at ATHs with minimal hedging creates crowded positioning risk consensus dismisses
Volatility Backdrop
ES futures volatility at the 42th percentile reflects a balanced environment where standard risk parameters apply. Volatility remains anchored at current levels, with no clear signal of an imminent regime shift in either direction.
Normal volatility regime suggests 1.0-1.5% daily ES moves expected with current session range 7,572.75-7,611.50 representing 0.5% width showing tight consolidation - June 16-17 FOMC binary outcome presents asymmetric expansion risk with potential 2-3% intraday swings on policy surprise either direction
The Week Ahead
FOMC two-day meeting June 16-17 with Powell press conference, markets price 100% hold probability but scrutinizing forward guidance after five weeks of ATH breakouts and Q1 earnings strength—any hawkish language shift triggers repricing risk from current extreme complacency levels on Tuesday 16 June is a high-impact catalyst with the potential to redefine the near-term outlook entirely.
How S&P 500 navigates the confluence of trending up conditions and incoming data will determine whether the current directional thesis holds or breaks.
This analysis covers one dimension. Our full weekly report combines six specialist agents into a single actionable briefing with directional bias, key levels, and risk-opportunity matrix.
Start Free — Get the Market of the WeekFree weekly report · No credit card · Upgrade anytime