S&P 500 Forecast This Week — Outlook, Drivers & Key Levels
This week's S&P 500 outlook: key drivers, volatility context, risk-opportunity assessment and the week ahead.

Where Things Stand
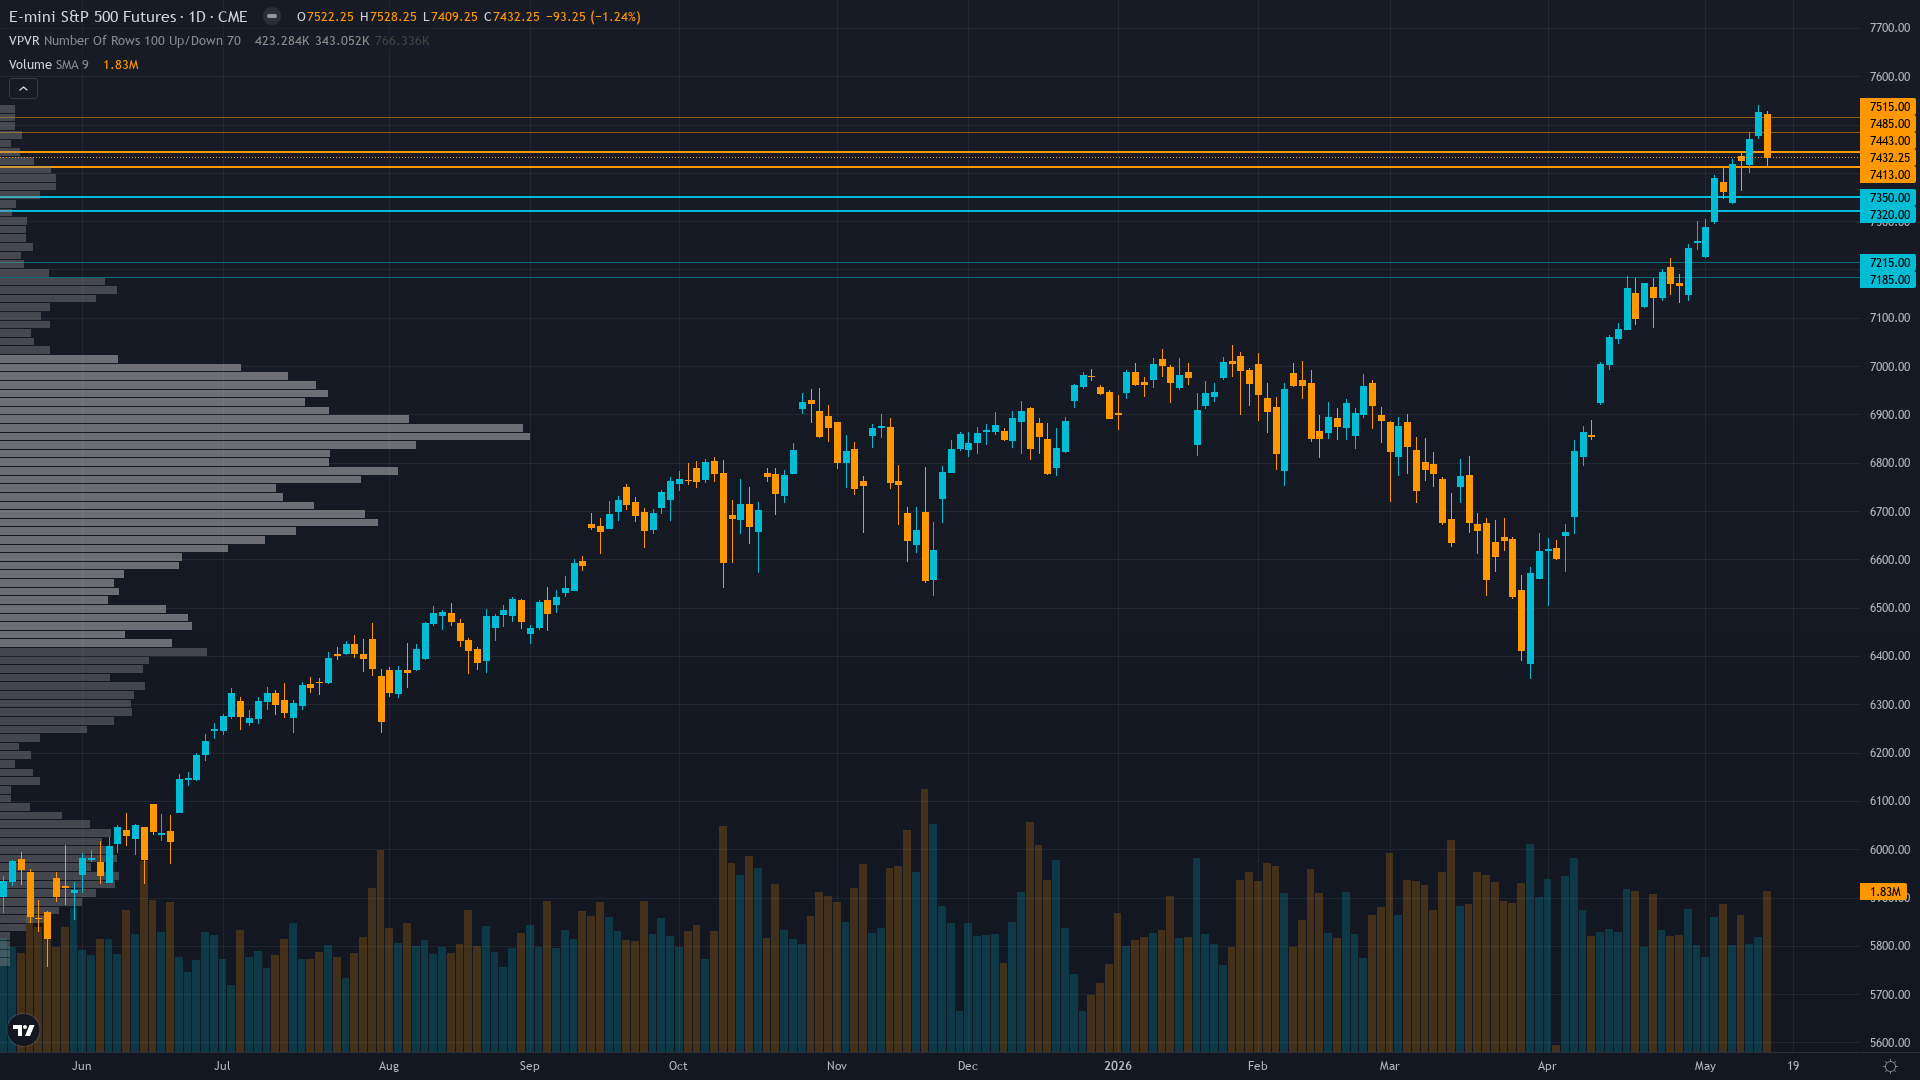
At 7432, S&P 500 has dropped 1.20% with sellers in control of the session. S&P 500 futures is in a trending up market state, requiring careful assessment of current conditions.
Cautiously bullish on Q1 earnings strength and labor resilience but increasingly aware RSI 71.18 approaching overbought and equity put/call 0.59 complacency create asymmetric downside risk, while Fed Chair transition uncertainty adds structural headwind through June 16-17 FOMC
What's Driving Price
Primary driver: ES at 7,432 pulled back sharply from 7,528 intraday high after testing psychological 7,500 resistance, as Fed Chair Powell's term expired May 15 creating forward guidance vacuum precisely when May 8 NFP beat (115K vs 62K) and Q1 earnings acceleration to 21% growth would justify policy clarity
Secondary factor: VIX compressed to 18.43 from last week's 17.99 showing calm surface but intraday spike to 19.27 signals renewed institutional caution, while equity put/call 0.59 bullish positioning (1.7 calls per put) creates asymmetric reversal vulnerability near all-time highs
Additional influence: Technical momentum extended with RSI 71.18 approaching overbought after testing 7,400 round number support intraday, creating near-term exhaustion pattern despite intact uptrend structure above 50-day MA 7,396 and 200-day MA 7,119
Economic backdrop: Fed at 3.50-3.75% with Chair Powell's term expired May 15, 2026 creating leadership vacuum until new Chair confirmed - June 16-17 FOMC includes dot plot but policy path uncertain, ISM Manufacturing 52.7 expansion, May 8 NFP beat 115K validates labor resilience
Fundamental assessment: Forward PE 21.0-22.4x moderately overvalued at 11-18% premium to 10-year average but justified by exceptional 21% earnings growth expectations for CY 2026 with Q1 delivering record 13.4% net margins - execution risk if AI spending assumptions prove optimistic
Chart Assessment
Strong uptrend with ES at 7,432 above 50-day MA 7,396 (+1.0%) and 200-day MA 7,119 (+4.4%), but RSI 71.18 approaching overbought after intraday pullback from 7,528 high testing 7,400 psychological support - momentum cooling without yet reaching neutral
With trend strength at 7/10, there's a clear directional tilt but room for the move to develop further.
Risk & Opportunity
Primary risk: Fed Chair transition uncertainty creates policy communication vacuum precisely when May 8 NFP beat and 21% Q1 earnings growth would justify forward guidance clarity - any hawkish surprise at June 16-17 FOMC from new Chair triggers multiple compression from forward PE 21-22x elevated levels testing 7,396 then 7,200 support (Probability: medium)
Primary opportunity: Sustained breakout above 7,528 intraday high toward 7,650-7,750 psychological resistance if June FOMC maintains accommodative bias despite Chair transition AND Q2 earnings season validates 21% growth trajectory enabling VIX compression below 17 with June-July seasonal strength materializing (Timeframe: May 20 - June 30 2026)
This week's edge: Market underestimating significance of Fed Chair Powell term expiration May 15 creating policy communication vacuum at moment when May 8 NFP beat and 21% Q1 earnings growth would justify forward guidance, while overestimating June FOMC new Chair dovish surprise probability given leadership transition typically produces cautious rhetoric - today's 96-point intraday reversal from 7,528 and extreme put/call 0.59 complacency at all-time highs creates structural vulnerability consensus dismisses
Volatility Backdrop
ES futures volatility at the 45th percentile reflects a balanced environment where standard risk parameters apply. Volatility remains anchored at current levels, with no clear signal of an imminent regime shift in either direction.
Normal volatility regime suggests 1.0-1.5% daily ES moves expected with today's 7,409-7,528 intraday range representing 1.6% width - June 16-17 FOMC binary outcome presents asymmetric expansion risk with potential 2-3% intraday swings on policy surprise either direction
The Week Ahead
June 16-17 FOMC two-day meeting with zero rate cut probability priced but markets scrutinizing first meeting post-Chair transition for policy trajectory clarity and updated dot plot projections amid Q1 earnings strength and labor market stability on Tuesday 16 June is a high-impact catalyst with the potential to redefine the near-term outlook entirely.
How S&P 500 navigates the confluence of trending up conditions and incoming data will determine whether the current directional thesis holds or breaks.
This analysis covers one dimension. Our full weekly report combines six specialist agents into a single actionable briefing with directional bias, key levels, and risk-opportunity matrix.
Start Free — Get the Market of the WeekFree weekly report · No credit card · Upgrade anytime