30-Year Treasury COT & Institutional Positioning — Smart Money Analysis
30-Year Treasury institutional positioning: COT data, sentiment analysis and smart money flow assessment.

Smart Money Positioning
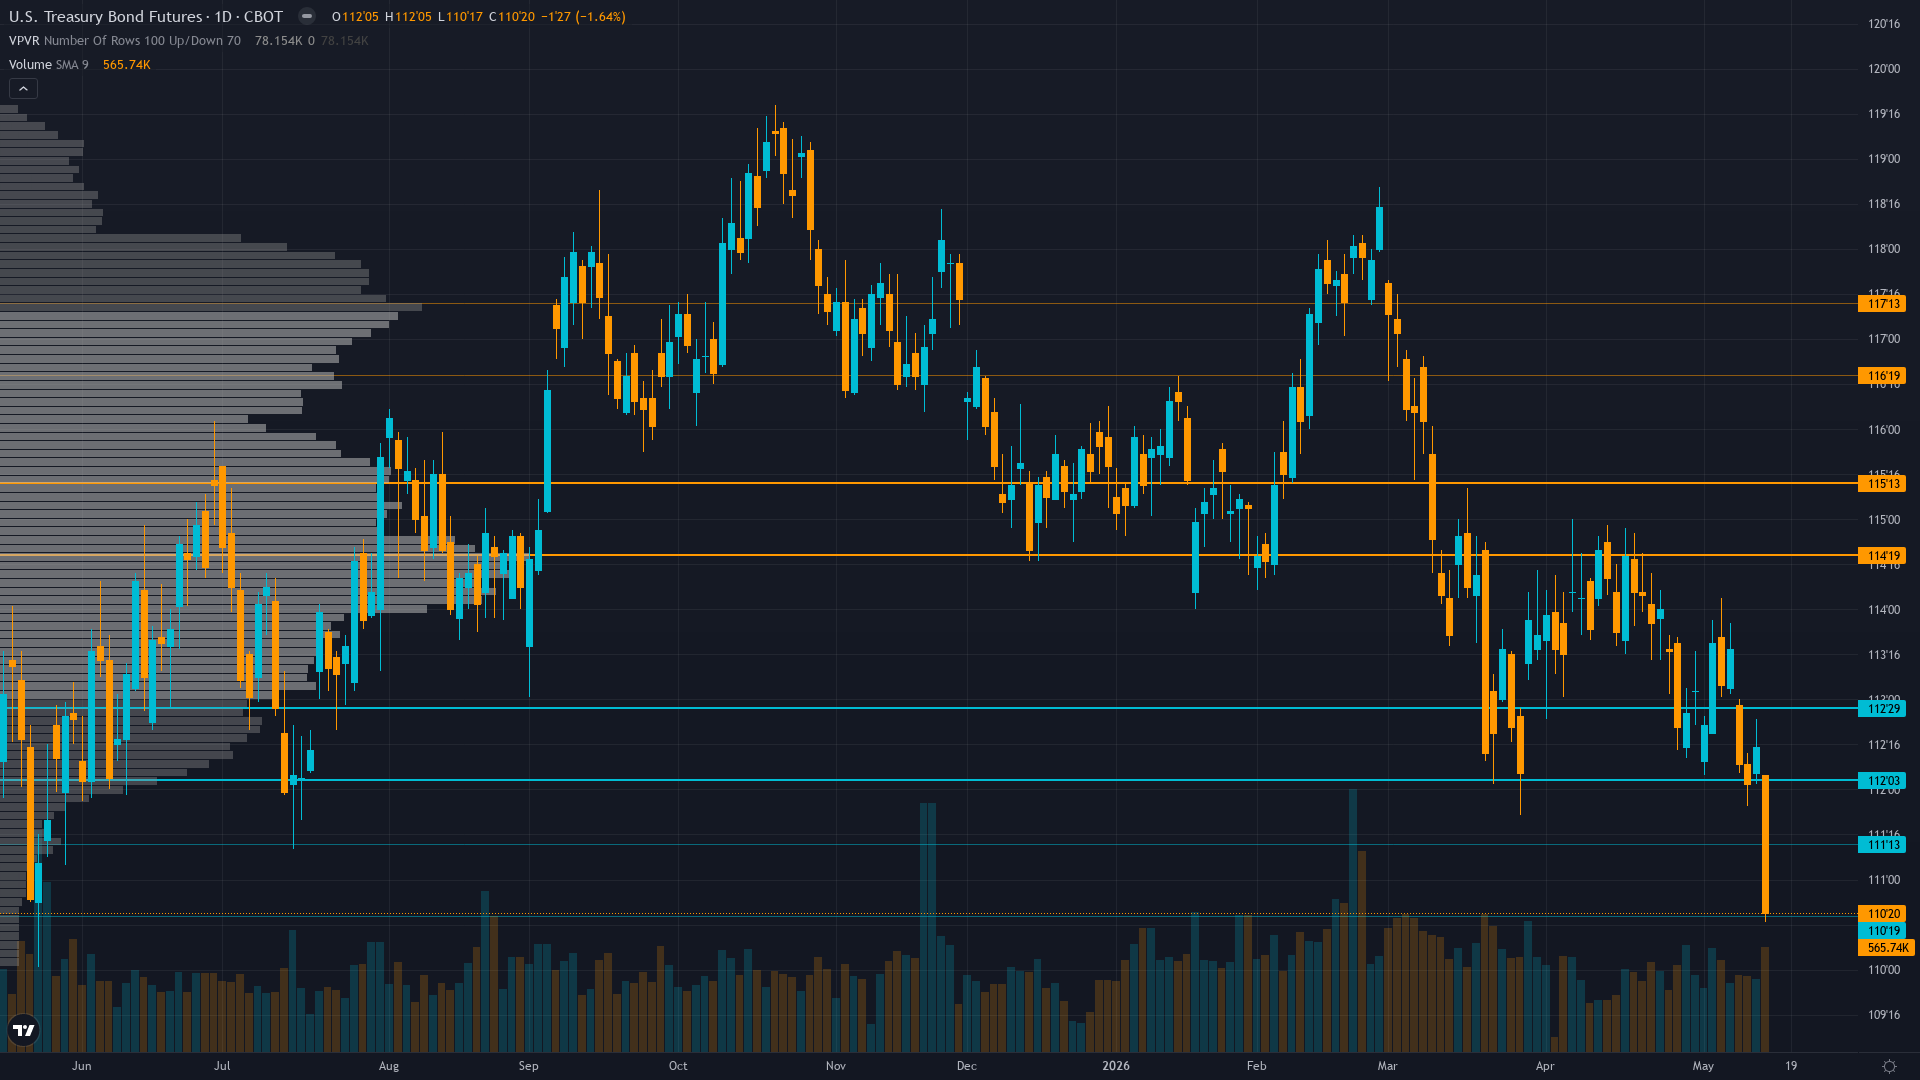
30-year Treasury holds at 112.31 in a holding pattern, with neither buyers nor sellers willing to force the issue.
Weak Treasury auction demand with May 13 30-year auction showing 2.30 bid-to-cover indicating adequate but not strong absorption as institutional flows turn cautious on duration despite $184.5B February TIC inflows maintaining baseline foreign support
Consensus Check
Market consensus: Market pricing Fed on extended hold through mid-2026 with terminal rate near 3% after yesterday's April CPI 0.6% MoM inflation shock; bonds consolidating 110-115 range awaiting May employment data and June FOMC clarity on whether energy-driven inflation spike represents trend reversal or transitory outlier
Primary driver: April CPI released May 16 showing 0.6% MoM with energy inflation at 17.9% YoY creating hawkish repricing shock that sent 30Y yields to 5.02% and ZB down 1.1% from 113.56 to 112.31 invalidating any Fed easing expectations through mid-2026
Divergence Assessment
Desk bearish lean aligns with consensus structural view from yesterday's CPI shock and Fed terminal rate near 3%; directional divergence moderate (15 points) as desk maintains bearish while Sentiment identifies contrarian oversold setup from bond panic headlines creating some deviation from pure consensus bearish; conviction asymmetry minimal (9 points) as desk at 5/10 reflects uncertainty proportional to market caution post-CPI; blindspot identification low (8 points) as CPI shock and fiscal supply pressure widely recognized though Sentiment contrarian signal from bond-specific capitulation vs equity greed may be underweighted factor
Market Sentiment
The sentiment picture for Treasury bond futures is evenly split, providing no contrarian signal in either direction. The next move will likely be event-driven.
What Options Markets Show
MOVE at 79.87 down 6.44% monthly represents extreme compression from prior elevated regime creating false calm despite bond market capitulation selling suggesting dangerous complacency ahead of potential mean reversion expansion
Positioning Summary
Putting the positioning picture together for ZB futures: sentiment is fear, trend strength registers just 2/10, which typically corresponds to choppy, directionless price action. The net assessment from institutional data, crowd positioning, and derivatives activity points to a market where the balance of forces tilts in a discernible direction.
This analysis covers one dimension. Our full weekly report combines six specialist agents into a single actionable briefing with directional bias, key levels, and risk-opportunity matrix.
Start Free — Get the Market of the WeekFree weekly report · No credit card · Upgrade anytime