S&P 500 Forecast This Week — Outlook, Drivers & Key Levels
This week's S&P 500 outlook: key drivers, volatility context, risk-opportunity assessment and the week ahead.

Current Market Picture
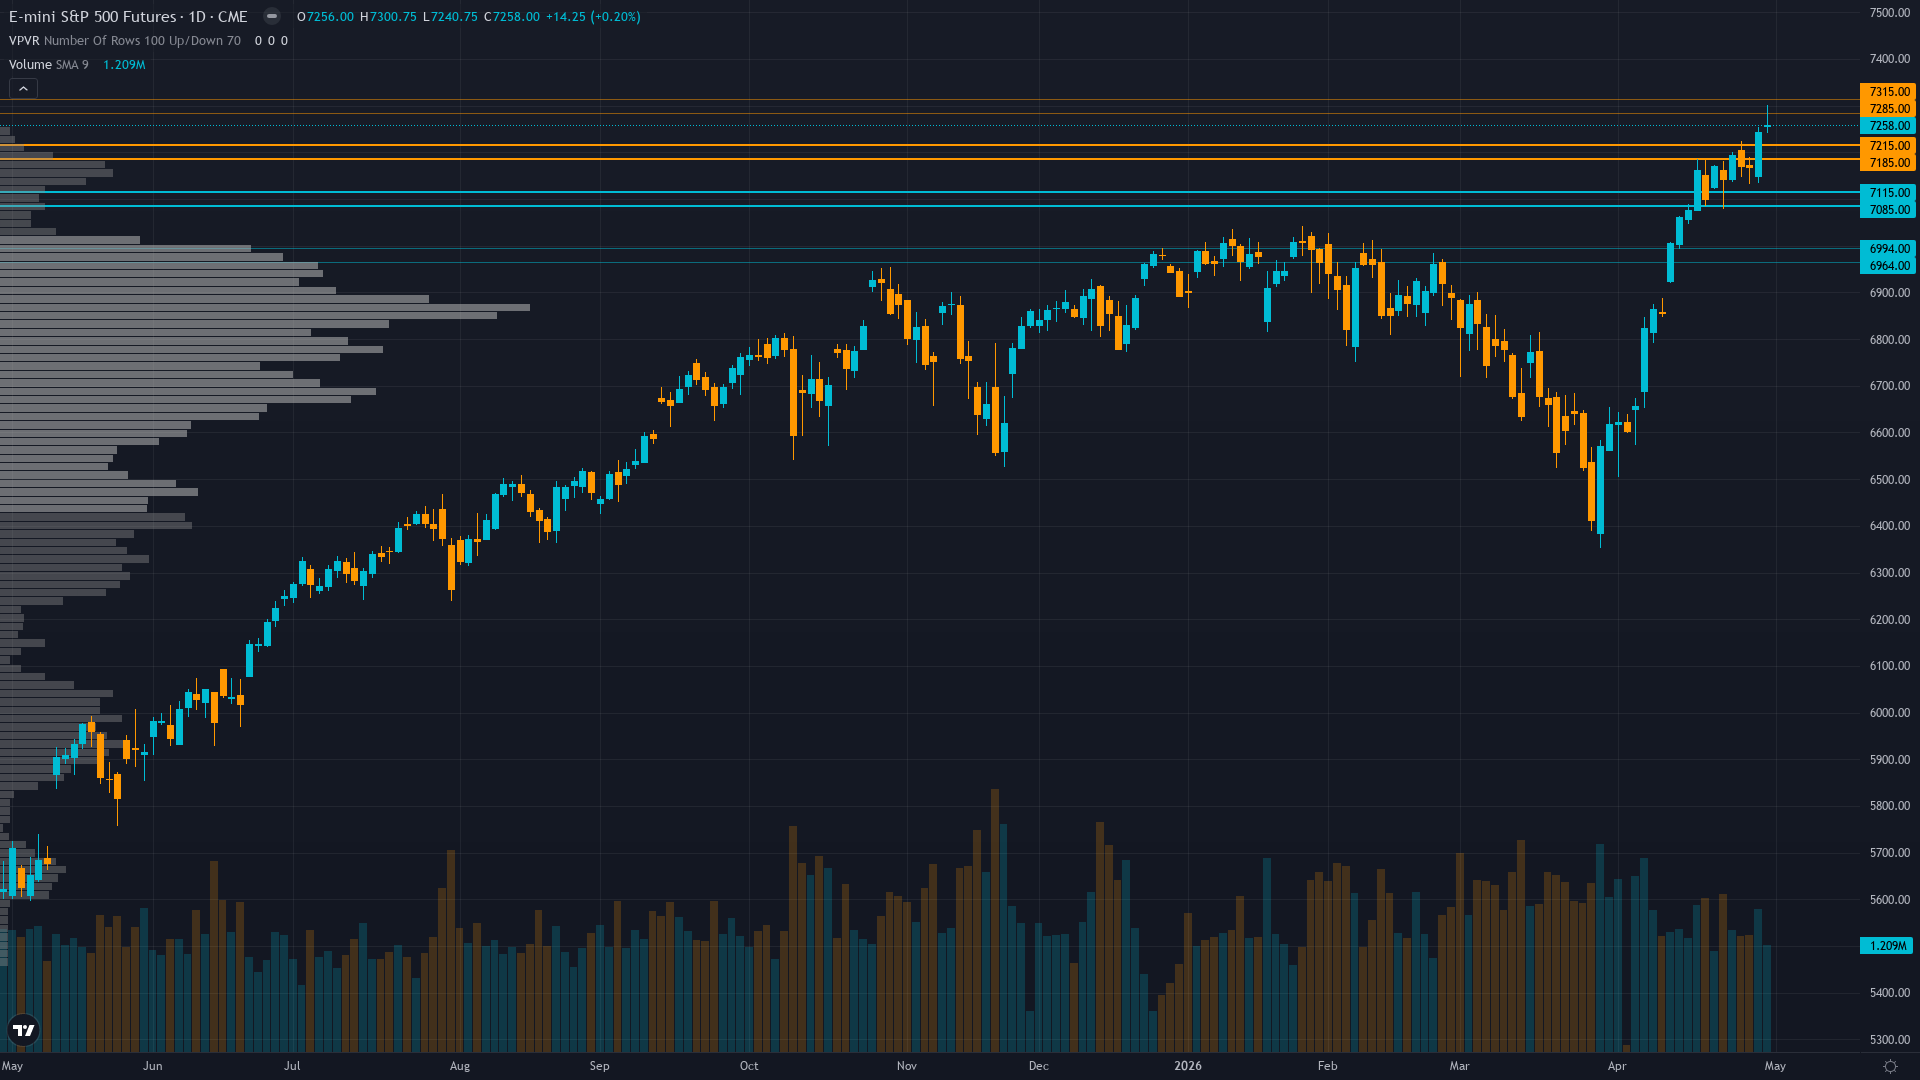
S&P 500 sits at 7258 after a 0.20% gain — a quiet move higher without aggressive momentum. S&P 500 futures is in a trending up market state, requiring careful assessment of current conditions.
Cautiously bullish on Q1 earnings strength and Fed policy stability but increasingly aware extreme put/call 0.46 complacency and 7,300 resistance persistence create asymmetric downside risk into May 7 FOMC catalyst
Key Drivers This Week
Primary driver: Q1 2026 earnings acceleration to 21.3% growth (highest since Q4 2021) with 63% of S&P 500 reported validating forward PE 20.9x multiples as ES tests 7,300 psychological resistance after May 1 fresh all-time high
Secondary factor: VIX compressed to 16.99 from March 31.05 extreme creating calm surface but equity put/call 0.46 extremely low (approximately 2.2 calls per put) signals dangerous complacency developing despite proximity to record highs
Additional influence: May 7 FOMC meeting 4 days away pricing 100% hold probability but April 29 Hammack dissent on easing bias creates forward guidance uncertainty as technical structure shows ES above all major MAs with RSI 69.17 approaching overbought
Economic backdrop: Fed at 3.50-3.75% after April 29 hold with Hammack dissenting on easing bias language, May 7 FOMC 4 days away pricing 100% hold but scrutinizing guidance, ISM Manufacturing 52.7 expansion, April NFP due creating binary catalyst risk
Fundamental assessment: Forward PE 20.9x at modest 5% premium to 5-year average justified by exceptional Q1 earnings acceleration to 21.3% growth with record 13.4% net profit margins - full-year 2026 growth projected 21.3% validates stretched multiples if execution delivers
Price Structure
Strong uptrend with ES at 7,258 well above 50-day MA 7,158 (+1.4%) and 200-day MA 6,851 (+5.9%), RSI 69.17 approaching overbought 70 threshold after testing 7,300.75 intraday resistance, volume 1.21M confirming recent upside moves
With trend strength at 8/10, the prevailing move carries significant force behind it.
Upside & Downside
Primary risk: May 7 FOMC removes or softens easing bias language following Hammack's April 29 dissent, triggering equity repricing of rate cut expectations and compressing forward PE 20.9x multiples from elevated levels as extreme put/call 0.46 complacency unwinds violently (Probability: medium)
Primary opportunity: Sustained breakout above 7,300 resistance toward 7,400-7,500 targets if May 7 FOMC maintains dovish rhetoric despite Hammack dissent AND remaining Q1 earnings season (37% yet to report) validates 21.3% growth trajectory enabling VIX compression below 16 (Timeframe: May 7-20 2026)
This week's edge: Market underestimating significance of 12 failed 7,300 breakout attempts since late April creating technical resistance fatigue while overestimating May 7 FOMC dovish surprise probability given Hammack's April 29 easing bias dissent - extreme put/call 0.46 complacency at all-time highs creates structural vulnerability consensus dismisses
Volatility Context
At the 42th percentile, ES futures volatility sits in a normal range, neither compressed enough to signal a breakout nor elevated enough to demand caution. Realised vol is holding its current level, suggesting the market has found a temporary equilibrium in its risk pricing.
Normal volatility regime suggests 1.0-1.5% daily ES moves expected with current 7,240-7,300 consolidation representing 0.8% range - May 7 FOMC binary outcome presents asymmetric expansion risk with potential 2-3% intraday swings on Powell rhetoric surprise either direction
Week Ahead Outlook
The next major catalyst is FOMC two-day meeting May 6-7 with Powell press conference at 2:30pm ET on May 7, markets price 100% hold probability but scrutinizing rhetoric after April 29 Hammack dissent on easing bias creates forward guidance uncertainty on Thursday 7 May — a high-impact event that could materially shift the directional picture.
For S&P index, the balance between existing momentum and scheduled risk events sets the stage for the week ahead.
This analysis covers one dimension. Our full weekly report combines six specialist agents into a single actionable briefing with directional bias, key levels, and risk-opportunity matrix.
Start Free — Get the Market of the WeekFree weekly report · No credit card · Upgrade anytime


