S&P 500 Forecast This Week — Outlook, Drivers & Key Levels
This week's S&P 500 outlook: key drivers, volatility context, risk-opportunity assessment and the week ahead.

Current Market Picture
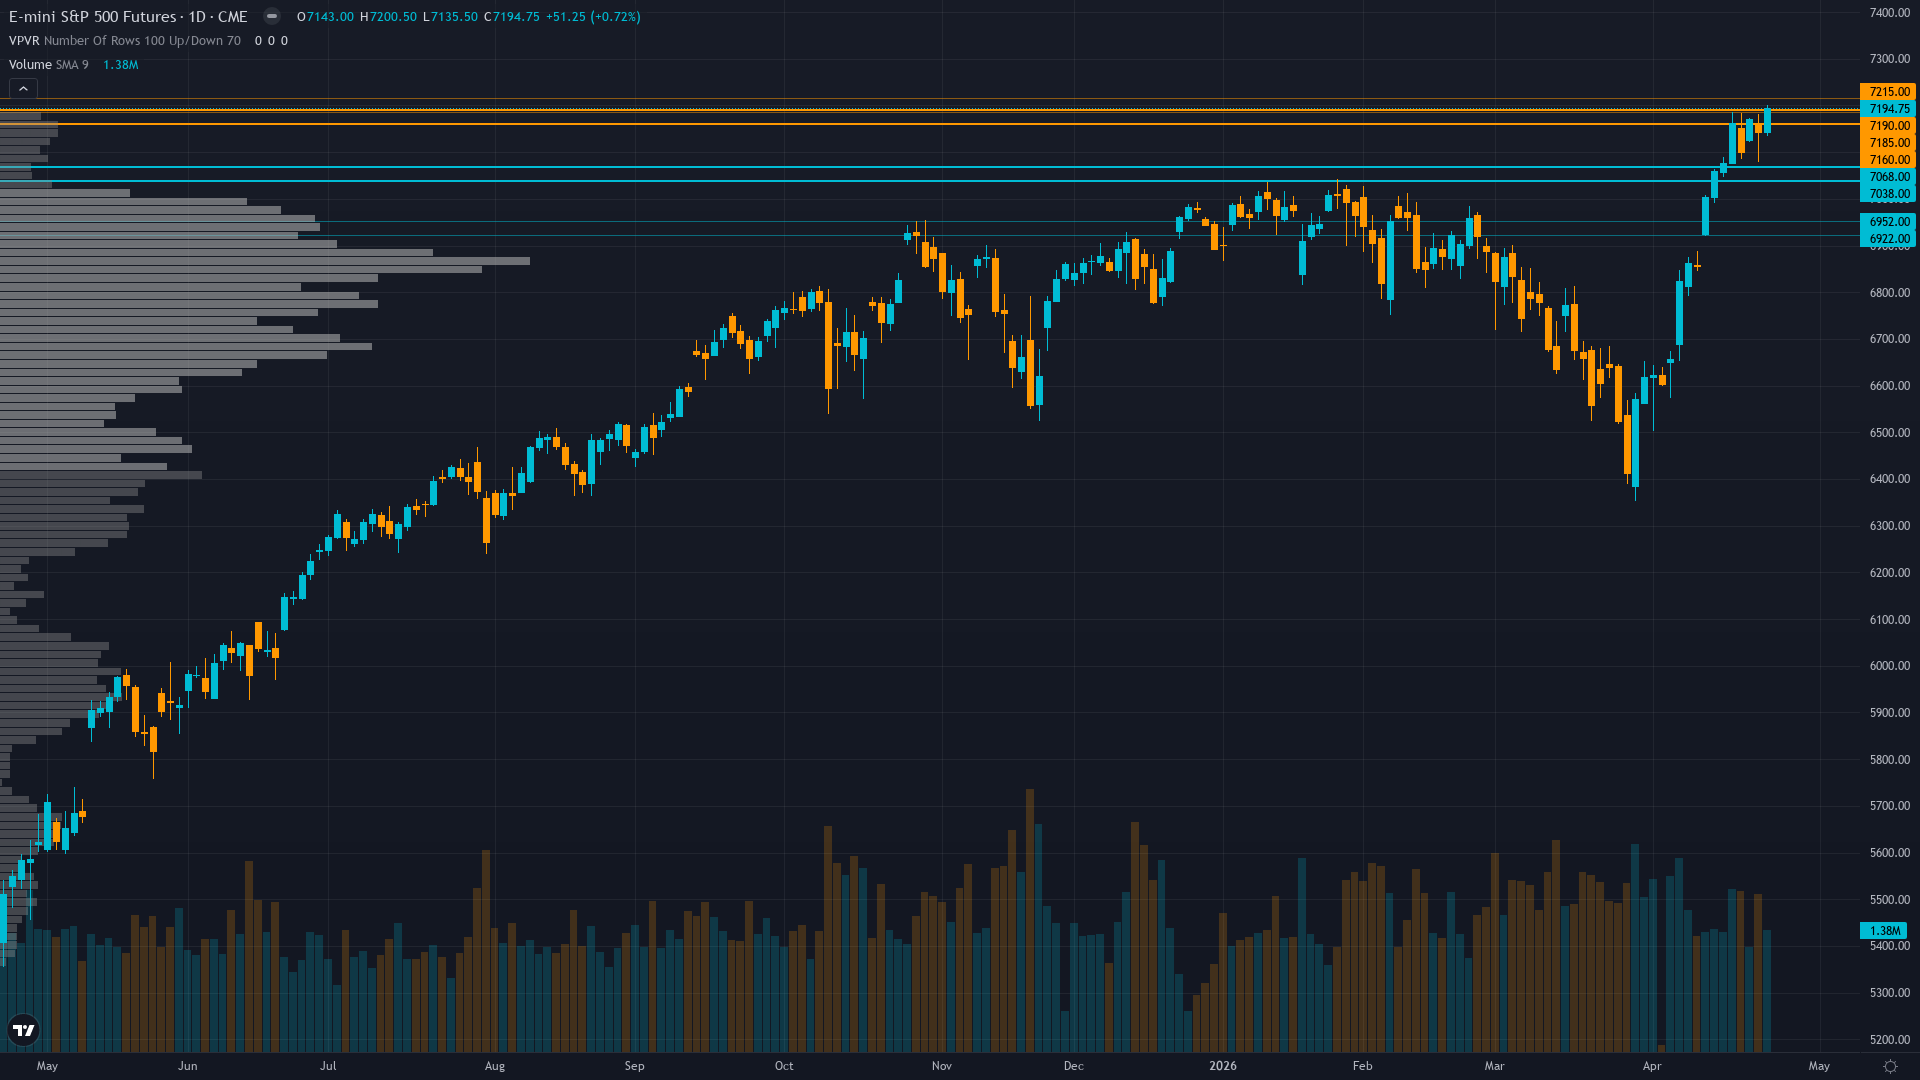
S&P 500 sits at 7194.75 after a 0.72% gain — a quiet move higher without aggressive momentum. The market in S&P 500 futures is coiling, with narrowing price ranges suggesting stored energy that will eventually release.
Cautiously bullish on Q1 earnings season strength and FOMC event uncertainty but aware 7,200 resistance remains formidable barrier with equity put/call 0.51 complacency creating asymmetric downside risk
Key Drivers This Week
Primary driver: FOMC April 28-29 binary catalyst approaching with zero cut priced as VIX compresses to 18.7 from March 31.05 extreme creating calm surface while Q1 earnings season 28% complete delivers sixth consecutive quarter 18.6% growth validating stretched multiples
Secondary factor: Sentiment regime shift from March extreme fear (VIX 31.05, AAII -17.7% spread) to current greed (Fear & Greed 70, AAII bulls 46%) creates wall-of-worry setup but equity put/call 0.51 extremely low showing dangerous complacency developing
Additional influence: Technical momentum strong with ES at 7,194.75 above all major MAs testing 7,200 psychological resistance but 20-day historical volatility compressed to 14.6% (very low category) suggesting range-bound action absent catalyst
Economic backdrop: Fed at 3.50-3.75% after January hawkish hold with April 28-29 FOMC pricing 100% hold probability, PMI strong at second-highest reading in 3 years, but policy paralysis persists as JPMorgan raises S&P 500 target to 7,600 on AI earnings cycle
Fundamental assessment: Forward PE 20.9x at 5% premium to 5-year average justified by Q1 earnings season delivering 18.6% growth with +60bp upward revision this week and record 14.2% net margins creating execution tailwind if companies deliver
Price Structure
ES at 7,194.75 testing 7,200 resistance with RSI 68.62 elevated but not overbought, above 50-day MA 6,979 and 200-day MA 6,705 confirming bullish structure yet momentum waning after testing intraday high 7,200.50
Trend strength sits at 7/10, reflecting a market that has directional bias but hasn't reached extreme conviction.
Upside & Downside
Primary risk: FOMC April 29 delivers hawkish hold reinforcing December one-cut 2026 guidance creating multiple compression risk from forward PE 20.9x elevated levels while month-end rebalancing selling amplifies downside testing 7,100 then 6,979 support (Probability: medium)
Primary opportunity: Q1 earnings season continuation validates 18.6% growth expectations with mega-cap tech delivering strong guidance enabling breakout above 7,200 toward 7,300-7,400 resistance as VIX compression below 18 and April-May seasonal strength materializes (Timeframe: April 29 - May 15 2026)
This week's edge: Market underestimating persistence of 7,200 resistance after 11 failed breakout attempts since January while overestimating FOMC dovish surprise probability given Fed policy paralysis at 3.50-3.75% and December one-cut guidance unchanged - complacent positioning at equity put/call 0.51 creates structural vulnerability to hawkish rhetoric confirmation
Volatility Context
At the 45th percentile, ES futures volatility sits in a normal range, neither compressed enough to signal a breakout nor elevated enough to demand caution. Realised vol is declining steadily, compressing into ranges that tend to snap when a catalyst breaks the equilibrium.
Normal volatility regime suggests 1.0-1.5% daily ES moves expected with current 7,100-7,200 consolidation representing 1.4% range - FOMC binary outcome April 29 presents asymmetric expansion risk with potential 2-3% intraday swings on Powell rhetoric surprise either direction
Week Ahead Outlook
The next major catalyst is FOMC two-day meeting April 28-29 with Powell press conference at 2:30pm ET, markets price 100% hold probability but scrutinizing rhetoric for any softening of restrictive stance amid Q1 earnings strength and labor market stability on Wednesday 29 April — a high-impact event that could materially shift the directional picture.
For S&P index, the balance between existing momentum and scheduled risk events sets the stage for the week ahead.
This analysis covers one dimension. Our full weekly report combines six specialist agents into a single actionable briefing with directional bias, key levels, and risk-opportunity matrix.
Start Free — Get the Market of the WeekFree weekly report · No credit card · Upgrade anytime


