S&P 500 COT & Institutional Positioning — Smart Money Analysis
S&P 500 institutional positioning: COT data, sentiment analysis and smart money flow assessment.

Where Institutions Stand
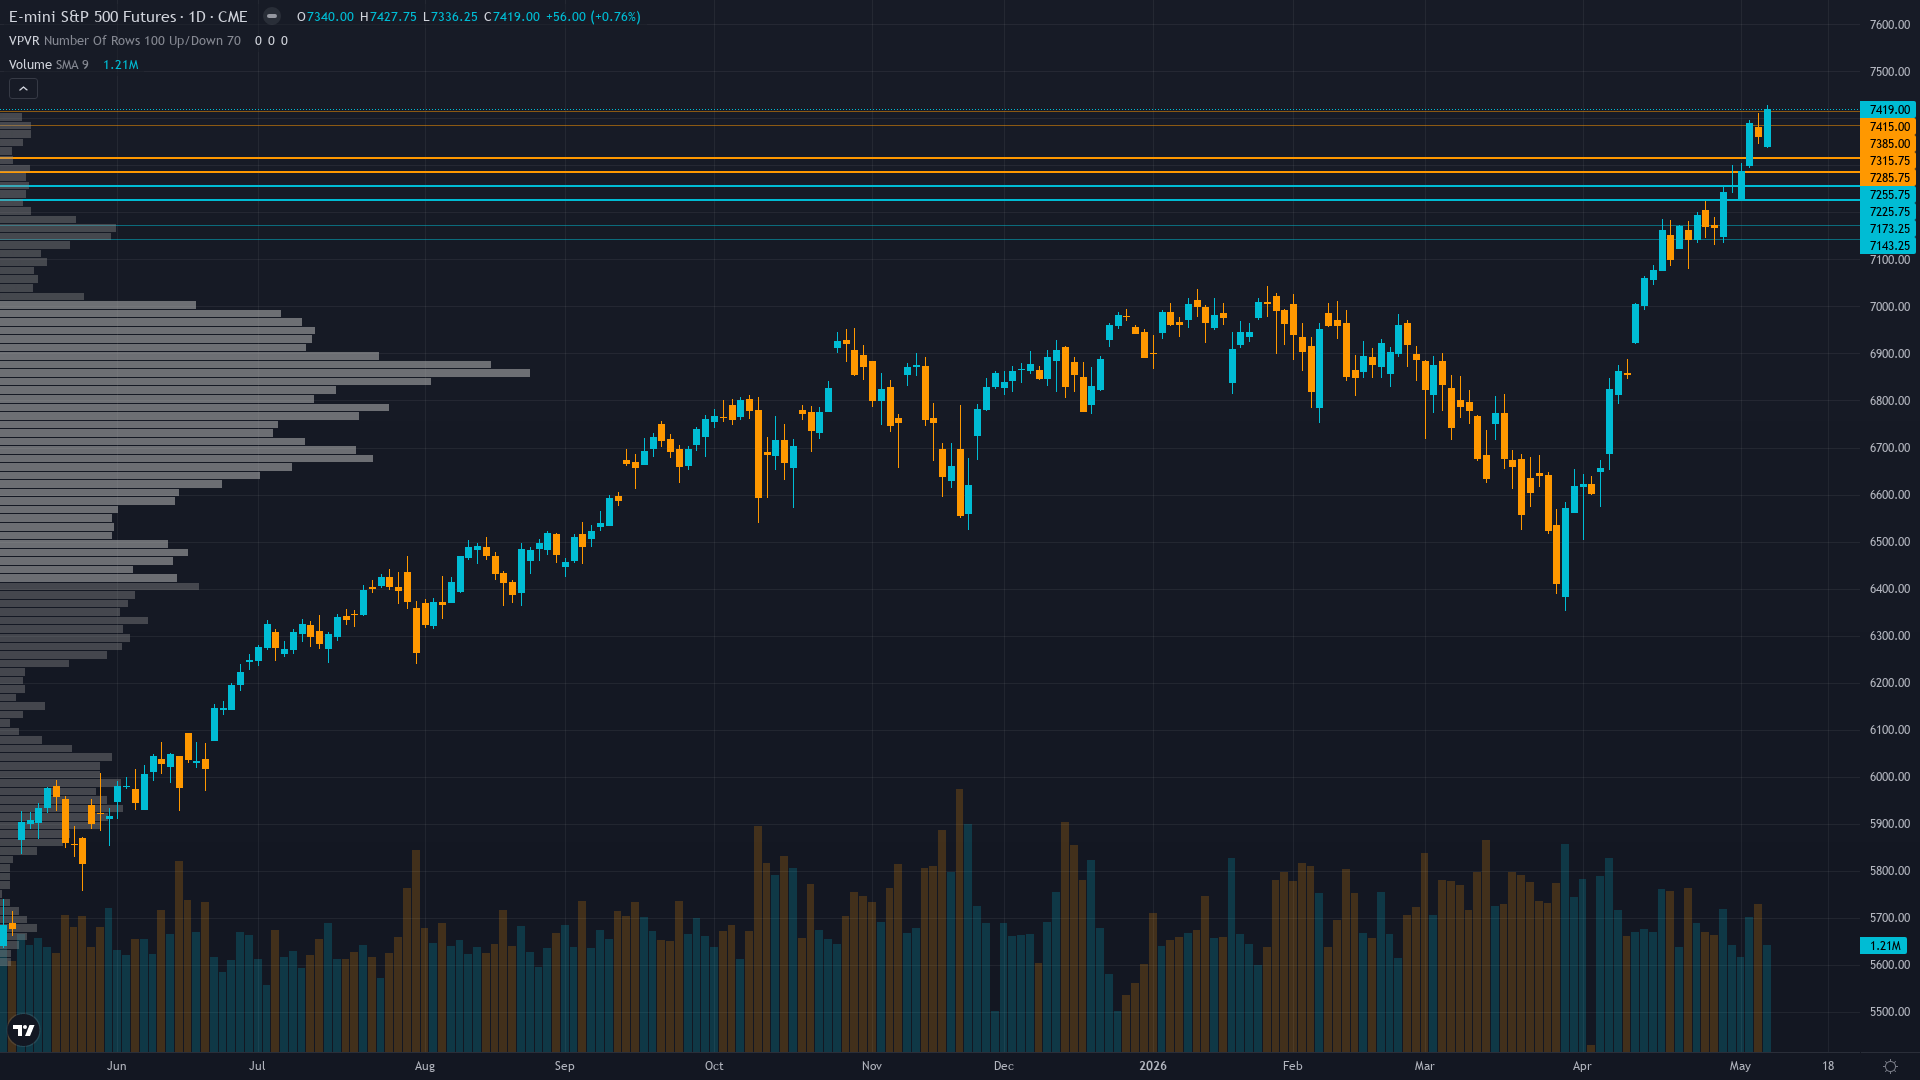
At 7419, S&P 500 has gained 2.18% over the past session with buying pressure clearly in the driving seat.
Mid-range positioning per stale April 28 COT data (12 days old) limits visibility but asset managers remain constructive on equity futures, though SPY showing -$4.59B 1-year outflows suggests passive allocation shifts despite strong price performance creating fragility
Consensus vs MAD View
Market consensus: Cautiously bullish on Q1 earnings strength and NFP resilience but increasingly aware extreme RSI 77.65 overbought and put/call 0.53 complacency create asymmetric downside risk into May 12 CPI catalyst with 7,428-7,500 resistance zone formidable
Primary driver: ES surges to 7,419 (+161 points from May 3 close of 7,258) extending breakout above 7,300 as May 8 NFP beat at 115K vs 62K expected validates labor resilience while Q1 earnings season 63% complete delivers 21.3% growth (highest since Q4 2021) with record 13.4% net margins justifying forward PE 21.0x
Where the Crowd May Be Wrong
Desk sees RSI 77.65 extreme overbought with equity put/call 0.53 dangerous complacency creating imminent mean-reversion risk into May 12 CPI catalyst while market consensus prices continuation rally toward 7,500+ on earnings strength and NFP optimism, creating moderate divergence on near-term correction probability and May 12 event risk that crowd underweights
Crowd Psychology
Neither side has committed heavily to S&P 500 futures, leaving sentiment in a neutral zone that offers little directional guidance on its own.
Options Flow
VIX 17.19 compressed near 52-week low 13.38 showing extreme calm while equity put/call 0.53 (approximately 1.9 calls per put) represents dangerous complacency with minimal hedging despite proximity to record highs - structural reversal vulnerability on any negative catalyst
The Bottom Line on Positioning
The positioning mosaic for S&P index combines greed sentiment with stable volatility conditions. Trend strength is elevated at 8/10, indicating strong directional conviction in current price action. Taken together, institutional behaviour, crowd psychology, and derivatives data frame the setup heading into the new week.
This analysis covers one dimension. Our full weekly report combines six specialist agents into a single actionable briefing with directional bias, key levels, and risk-opportunity matrix.
Start Free — Get the Market of the WeekFree weekly report · No credit card · Upgrade anytime