Soybeans Forecast This Week — Outlook, Drivers & Key Levels
This week's Soybeans outlook: key drivers, volatility context, risk-opportunity assessment and the week ahead.

Where Things Stand
soybeans holds at 1201.5, up a marginal 0.52% as the market grinds forward. soybean futures is in a consolidating near highs market state, requiring careful assessment of current conditions.
Mixed with technical bulls citing intact uptrend and renewable diesel structural support offset by positioning analysts warning of extreme crowding at 90th+ percentile and fundamental analysts noting Brazilian pricing advantages creating two-way uncertainty
What's Driving Price
Primary driver: Technical momentum breakdown as managed money positioning reaches record net long 185,282 contracts at 90th+ percentile creating extreme contrarian bearish signal, yet price consolidates at 1201.50 cents just 21 cents below 52-week high of 1223.25 creating structural tension between positioning extremes and resilient technical structure
Secondary factor: Fundamental overvaluation pressure from Brazilian soybeans trading $0.80-$1.00 below US Gulf representing 8-10% pricing disadvantage that April WASDE acknowledged but renewable diesel structural demand at 2.61B bushels (up 35M from March) provides genuine floor absorbing 60%+ of crop
Additional influence: US planting progress at 12% complete well ahead of 5-year average per April 27 USDA Crop Progress report with frost risk from Canadian cold air affecting portions of Central Plains creating localized production risk but not systemic supply disruption heading into May 12 WASDE binary catalyst
Economic backdrop: TRANSITIONAL macro regime with VIX at 16.89 below 20 risk-on threshold indicating low volatility, DXY weakness at 98.22 down 1.80% monthly improving theoretical export competitiveness, but crude oil at $105+ elevating agricultural input costs creating mixed signals with neither direction showing structural advantage
Fundamental assessment: Moderately overvalued at $12.01/bushel versus USDA April forecast $10.30 season-average price, comfortable global stocks at 124.79 MMT and 8.2% US stocks-to-use ratio offset by record renewable diesel demand providing structural floor independent of export competitiveness
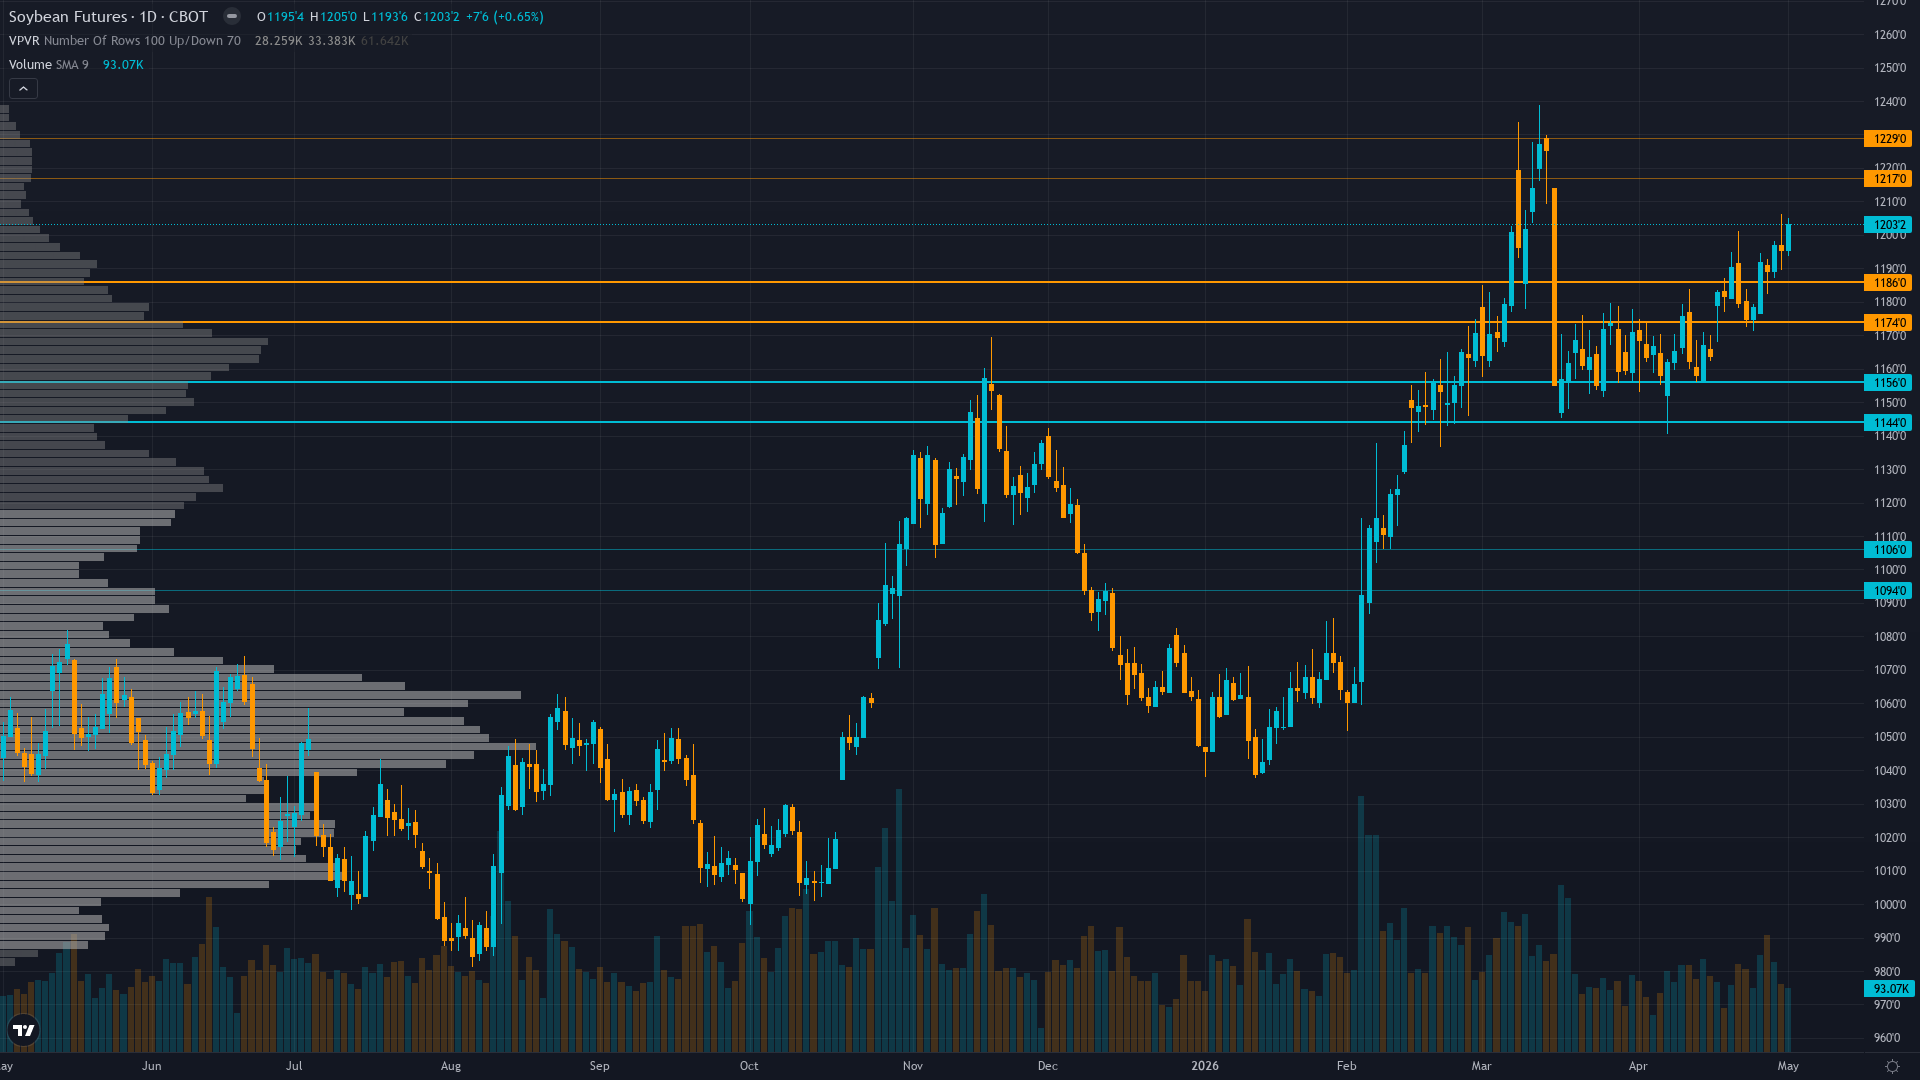
Chart Assessment
Consolidating at 1201.50 cents near 52-week high of 1223.25 with Strong Buy technical ratings from moving average alignment, momentum constructive but approaching overbought levels with price holding above psychological 1200 level after breaking out from 1175 base
With trend strength at 6/10, there's a clear directional tilt but room for the move to develop further.
Risk & Opportunity
Primary risk: Extreme speculative positioning at 90th+ percentile combined with Goldman Roll index fund selling May 5-9 period triggering cascading long liquidation if May 12 WASDE shows larger-than-expected 2026 US acreage or continued export weakness forcing prices toward 1150-1175 support representing 3-5% downside as Brazilian competition maintains persistent pricing advantage (Probability: medium)
Primary opportunity: South American late-season weather disruption during May critical reproductive phase or unexpected surge in Chinese demand reversing export weakness pattern triggering short-covering rally from extreme positioning toward breakout above 1223.25 resistance toward 1240-1250 representing 2-4% upside (Timeframe: Next 2-3 weeks through May 12 WASDE and resolution of Goldman Roll positioning adjustment period)
This week's edge: Signal magnitude +0.3 falls below 1.0 minimum threshold for AGRICULTURAL directional bias per Rule 2, mandating NO CALL despite extreme managed money positioning at 90th+ percentile and approaching May 12 WASDE binary catalyst, as severe discipline conflicts and TRANSITIONAL macro regime create insufficient conviction for directional lean where market faces genuine two-way risk between positioning unwind versus technical breakout continuation
Volatility Backdrop
soybean price volatility at the 60th percentile reflects a balanced environment where standard risk parameters apply. Volatility contraction continues, building the stored energy that typically precedes the next significant directional move.
Current normal volatility at 60th percentile suggests 15-20 cent daily ranges near typical agricultural baseline, consolidation patterns likely with false breakouts common requiring patience for directional conviction, standard stop placement appropriate at 20-25 cents for positioning with May 12 WASDE binary risk warranting wider 30-35 cent stops for event exposure
The Week Ahead
USDA May WASDE report updating supply-demand balances incorporating March 31 Prospective Plantings acreage data and providing first official 2026/27 production forecast plus South American harvest finalization and critical assessment of US export pace versus projections on Tuesday 12 May is a high-impact catalyst with the potential to redefine the near-term outlook entirely.
How soybeans navigates the confluence of consolidating near highs conditions and incoming data will determine whether the current directional thesis holds or breaks.
This analysis covers one dimension. Our full weekly report combines six specialist agents into a single actionable briefing with directional bias, key levels, and risk-opportunity matrix.
Start Free — Get the Market of the WeekFree weekly report · No credit card · Upgrade anytime


