Soybeans COT & Institutional Positioning — Smart Money Analysis
Soybeans institutional positioning: COT data, sentiment analysis and smart money flow assessment.

Institutional Positioning
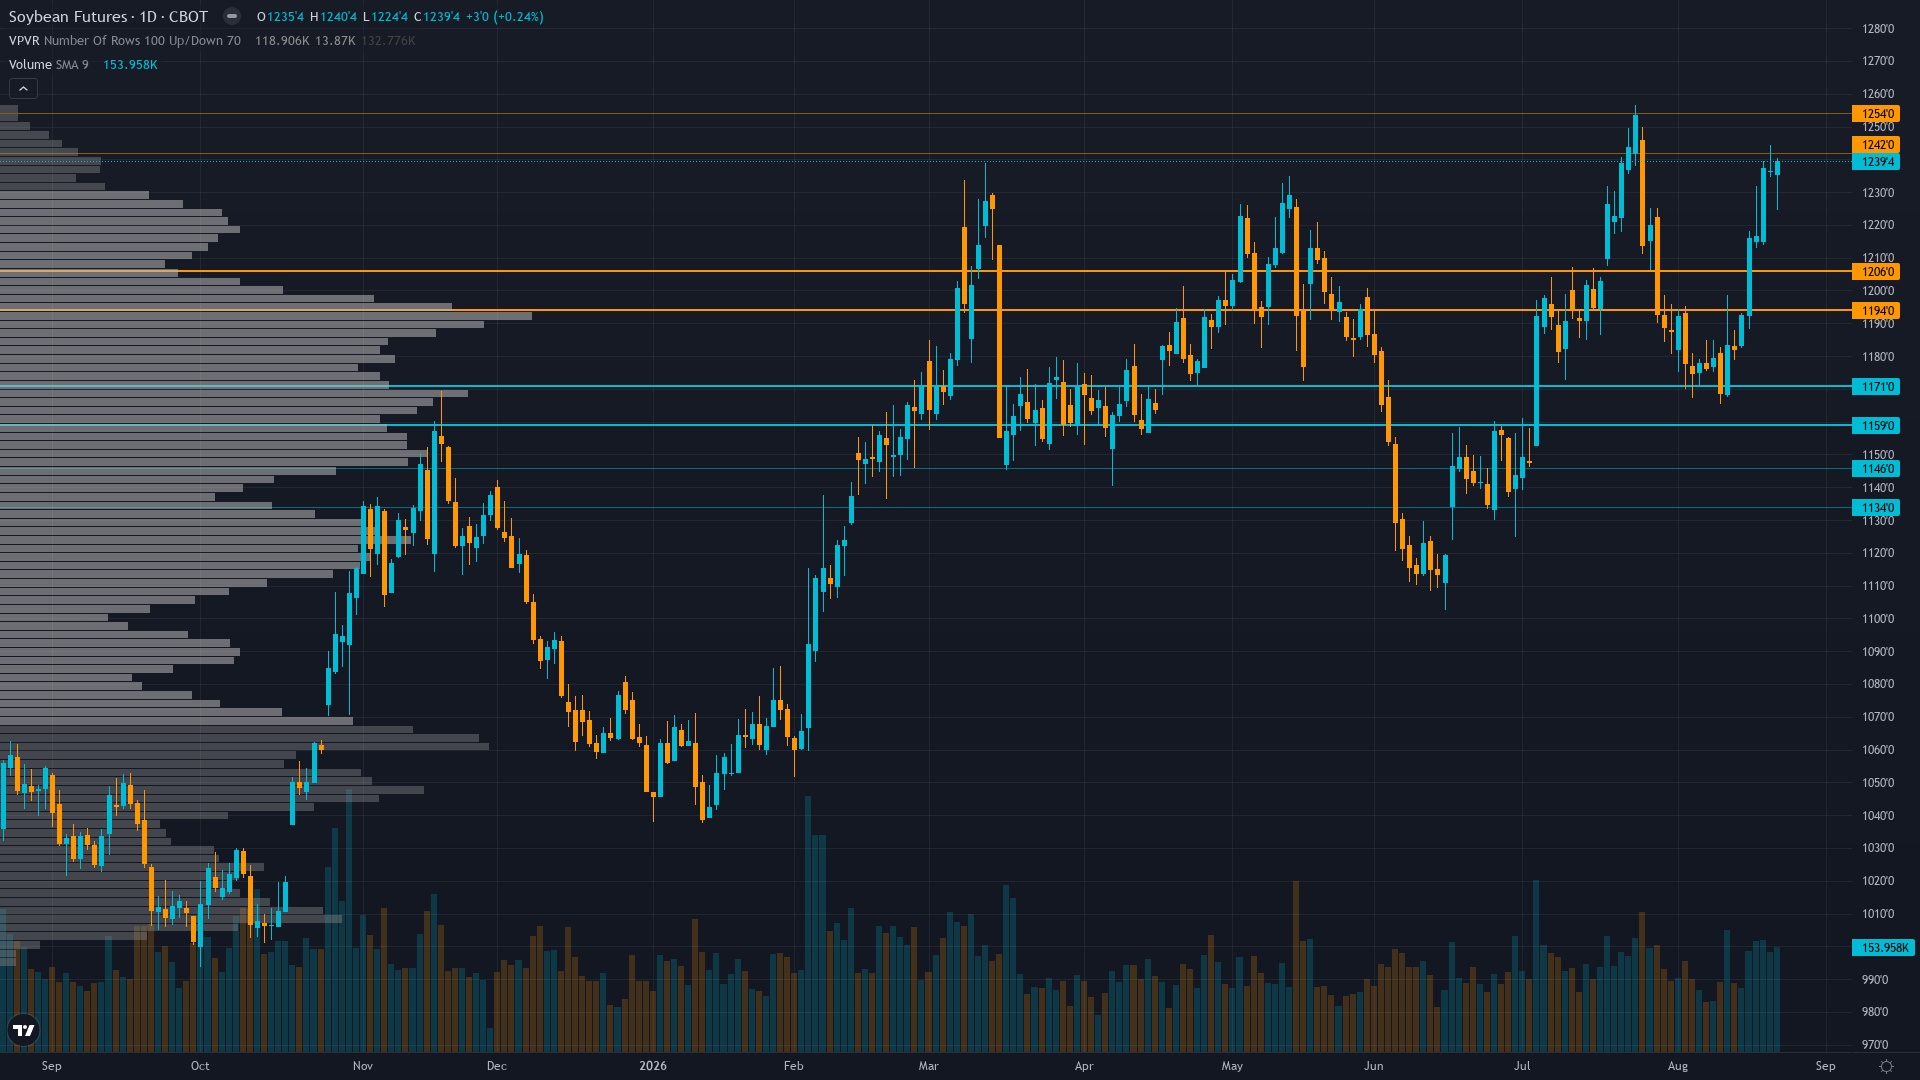
soybeans is trading at 1225, up a modest 0.74% as the market edges higher.
Non-commercial net long 190,961 contracts as of Aug 18 (84.8th percentile of 3-year range), up 31,016 contracts weekly, positioning now at historically elevated levels suggesting crowded long trade; commercial hedgers net short -169,637 contracts indicating aggressive producer hedging into crop tour-driven rally ahead of harvest
Where We Agree & Diverge
Market consensus: Mixed with bullish demand tone: Pro Farmer Crop Tour yield estimate of 53.3 bu/acre above USDA 52.7 provides bearish supply surprise potential, but explosive Chinese buying at 1.13M tons weekly and record renewable diesel crush provide powerful demand-side support, creating two-way risk near 52-week highs with prices consolidating between 1,200-1,248 ahead of September WASDE resolution
Primary driver: Pro Farmer Crop Tour final estimate of 4.572 billion bushels (53.3 bu/acre yield) released August 21, 2026, ABOVE USDA August WASDE of 52.7 bu/acre, creating supply uncertainty as market reconciles tour data with official projections ahead of September WASDE
Consensus Gaps
Low divergence as mandatory NEUTRAL bias due to 6 consecutive missed calls prevents contrarian statement; the desk's assessment that Pro Farmer's 53.3 bu/acre yield estimate and elevated 84.8th percentile speculative positioning create genuine two-way risk is largely aligned with market consensus uncertainty between supply and demand forces near 52-week highs
Sentiment Analysis
Positioning in soybean futures is balanced, with neither bulls nor bears holding a decisive edge. Neutral sentiment typically precedes a directional catalyst.
Derivatives Intelligence
Limited data for agricultural options markets; post-crop-tour implied volatility likely stable as Pro Farmer estimate uncertainty resolved; insufficient data for directional signal from options market
Net Assessment
The institutional landscape for soybean price shows greed sentiment. Trend strength registers at 7/10, suggesting meaningful but not extreme directional bias. The combination of positioning data, sentiment, and options flow provides context for understanding where smart money is leaning heading into the week.
This analysis covers one dimension. Our full weekly report combines six specialist agents into a single actionable briefing with directional bias, key levels, and risk-opportunity matrix.
Start Free — Get the Market of the WeekFree weekly report · No credit card · Upgrade anytime