30-Year Treasury COT & Institutional Positioning — Smart Money Analysis
30-Year Treasury institutional positioning: COT data, sentiment analysis and smart money flow assessment.

The Institutional Landscape
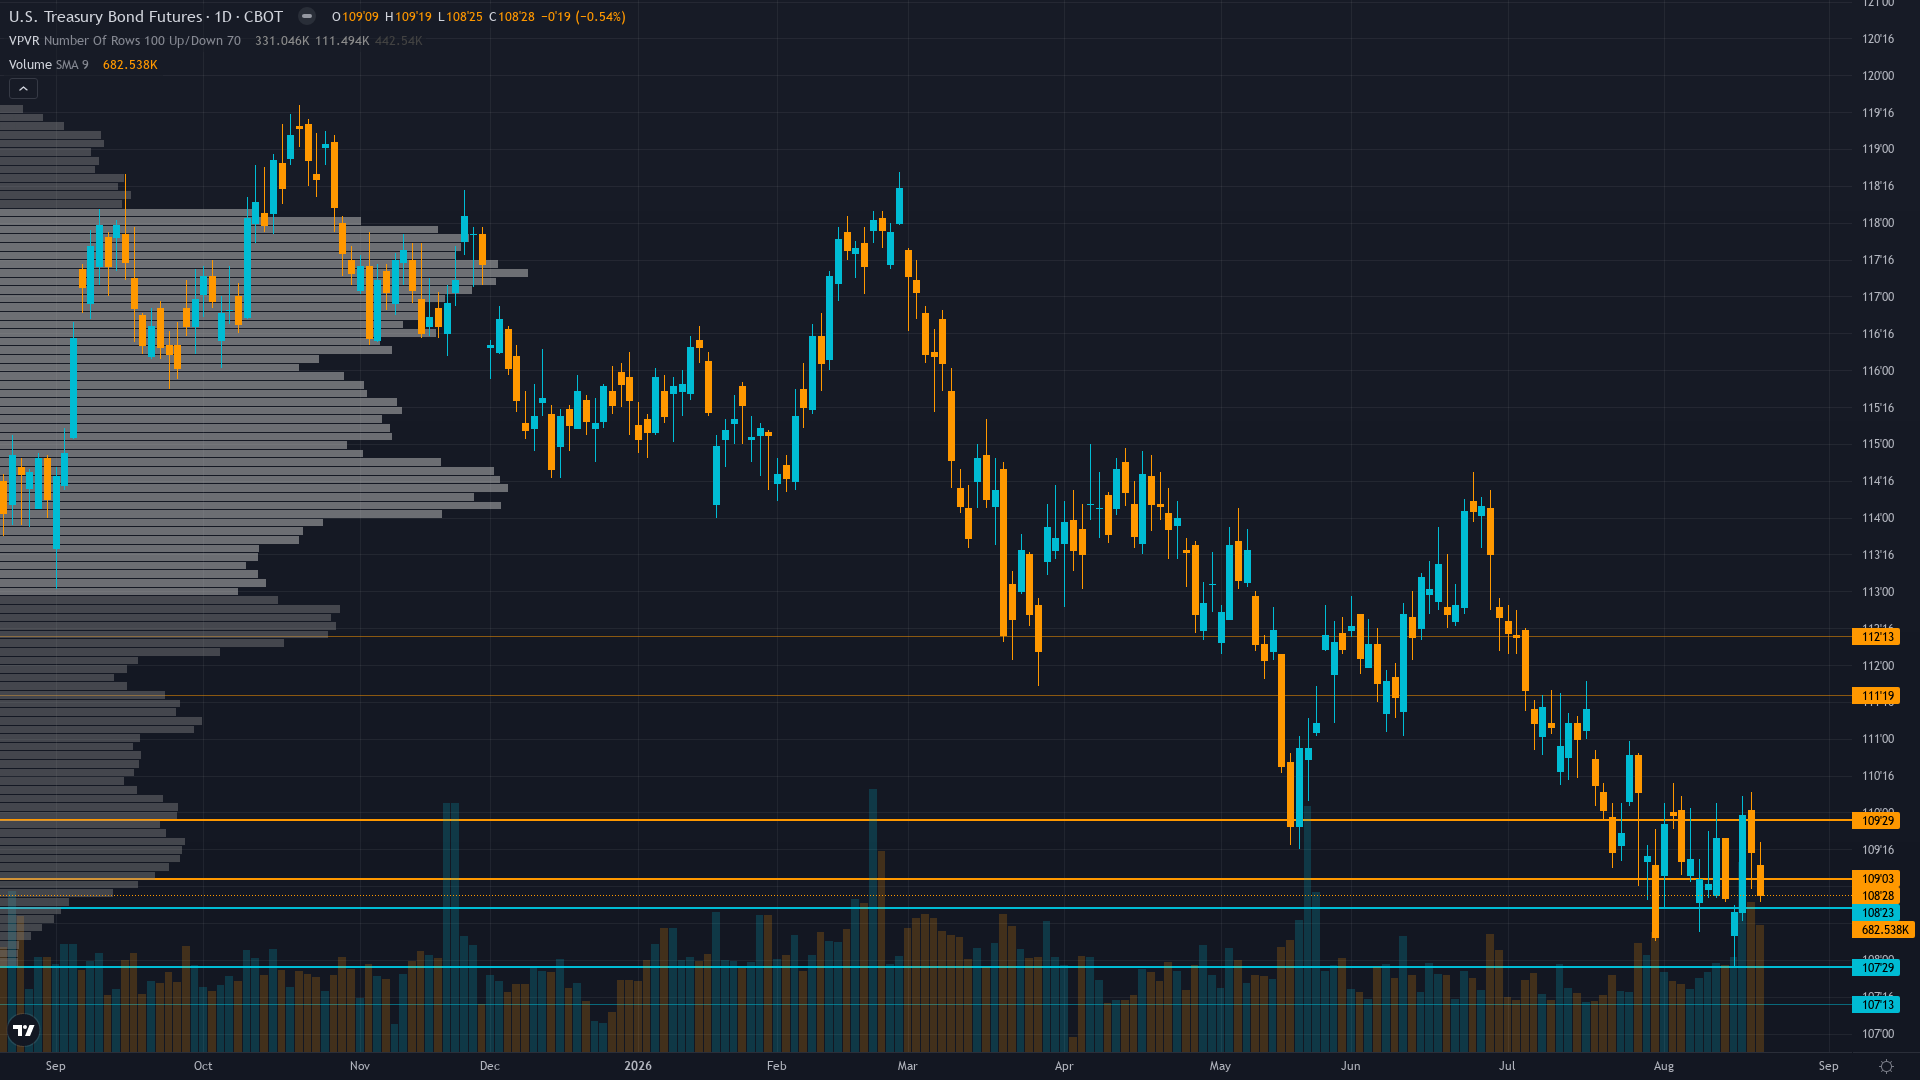
30-year Treasury holds at 108.875, up a marginal 0.03% as the market grinds forward.
CFTC COT Aug 18: non-commercial net short -219,012 contracts at 1.3rd percentile of 3-year range with weekly increase of 39,405 shorts — extreme bearish speculative crowding near 3-year minimum; commercial net long 164,664 providing structural bid; Treasury buyback doubling adds official-sector support for long end creating squeeze potential
Market Consensus vs Our Analysis
Market consensus: Market pricing structural bearish duration environment with 30Y at 5.27% near 19-year highs; ZB consolidating at 108.875 near 52-week low 108.31 awaiting Aug 26 PCE for directional catalyst; extreme COT short positioning at 1.3rd percentile acknowledged as squeeze risk but not acted upon without catalyst; Bessent buyback doubling (Aug 19) provides fresh official-sector support tailwind
Primary driver: 30-year yield at 5.27% near 19-year highs with ZB consolidating at 108.875 just 0.5% above 52-week low 108.3125; structural bearish supply dynamics (FY2026 deficit $1.8T, foreign holdings declining $72.1B in June) fully priced near range floor while extreme COT non-commercial net short at -219,012 contracts (1.3rd percentile of 3-year range) creates asymmetric squeeze potential; key PCE data Aug 26 as near-term catalyst
Contrarian Assessment
Moderate divergence: desk's NO CALL stance and identification of the Aug 19 Treasury buyback doubling as a material bullish blindspot contrasts with consensus bearish positioning and extreme speculative shorts at 1.3rd percentile, but NO CALL bias caps divergence below 40
Sentiment & Positioning
Sentiment around Treasury bond futures is neutral, with no extreme positioning on either side. This balanced state often resolves when a catalyst breaks the equilibrium.
Options Market Signal
MOVE Index at 73.18 up 2.69% daily indicating modestly elevated bond volatility but well below post-FOMC peaks near 80+; no directional skew signal available from ZB options data; declining vol from prior elevated levels suggests market not pricing imminent breakout catalyst despite extreme COT positioning
Putting It Together
In summary, the positioning picture for 30-year Treasury reflects neutral conviction levels set against a consolidating market backdrop. Trend strength registers just 3/10, which typically corresponds to choppy, directionless price action. The interplay between smart money activity, retail sentiment, and options market signals will shape how this positioning resolves.
This analysis covers one dimension. Our full weekly report combines six specialist agents into a single actionable briefing with directional bias, key levels, and risk-opportunity matrix.
Start Free — Get the Market of the WeekFree weekly report · No credit card · Upgrade anytime