Soybeans COT & Institutional Positioning — Smart Money Analysis
Soybeans institutional positioning: COT data, sentiment analysis and smart money flow assessment.

Institutional Positioning
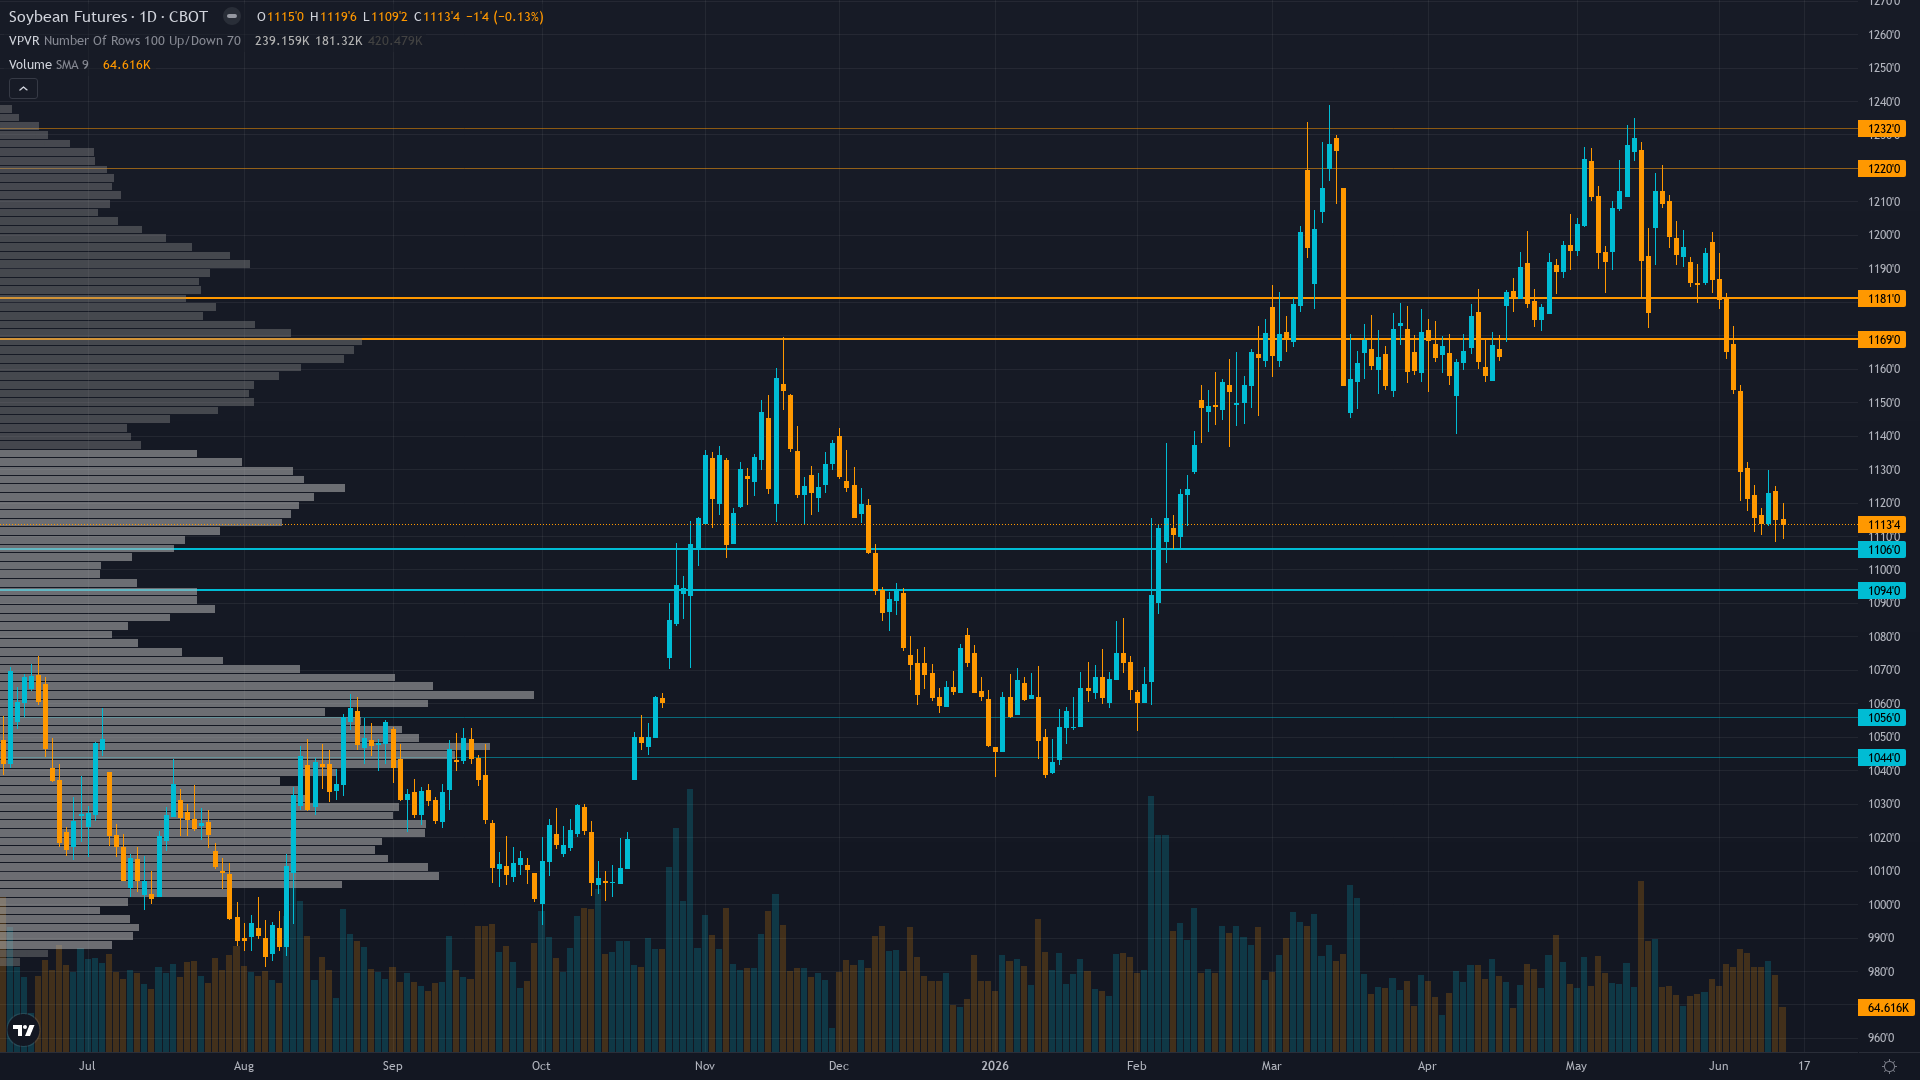
soybeans sits at 1113.5 after slipping 0.13% — a shallow pullback rather than a decisive move.
Managed money aggressively liquidated from 120,136 to 97,859 net long contracts representing 22,277 contract reduction (-18.5%) in week ending June 9 during Goldman Roll period creating mechanical index fund selling pressure, positioning at mid-range historically (55th-65th percentile) no longer at extremes but momentum clearly bearish
Crowd Psychology
Neither side has committed heavily to soybean futures, leaving sentiment in a neutral zone that offers little directional guidance on its own.
Options Flow
Insufficient data availability for ZS agricultural futures options with July IV at 12.68% (stale, approximately 2 weeks old) reflecting post-WASDE compression, thin liquidity characteristic of agricultural options markets prevents meaningful directional assessment reducing signal contribution to near-zero
Market Consensus vs Our Analysis
Market consensus: Mixed with technical bears citing breakdown momentum and positioning liquidation offset by fundamental bulls noting June 11 WASDE declining stocks-to-use ratio and renewable diesel structural support creating range-bound consolidation expectations between 1100-1150 ahead of July 10 WASDE binary event
Primary driver: Signal magnitude +0.35 falls below 1.0 minimum threshold for AGRICULTURAL directional bias per Rule 2 mandating NO CALL, as severe discipline conflicts create analytical paralysis where Fundamental/Institutional bullish cluster (+2.5 and +0.5) opposing Technical/Economic bearish cluster (-2.0 and -0.5) generates insufficient edge despite June 11 WASDE decreasing ending stocks and raising soybean oil demand 7% to 17.8B pounds
Putting It Together
In summary, the positioning picture for soybeans reflects neutral conviction levels set against a breaking down market backdrop. Trend strength registers just 3/10, which typically corresponds to choppy, directionless price action. The interplay between smart money activity, retail sentiment, and options market signals will shape how this positioning resolves.
This analysis covers one dimension. Our full weekly report combines six specialist agents into a single actionable briefing with directional bias, key levels, and risk-opportunity matrix.
Start Free — Get the Market of the WeekFree weekly report · No credit card · Upgrade anytime


