Silver Forecast This Week — Outlook, Drivers & Key Levels
This week's Silver outlook: key drivers, volatility context, risk-opportunity assessment and the week ahead.

Current Market Picture
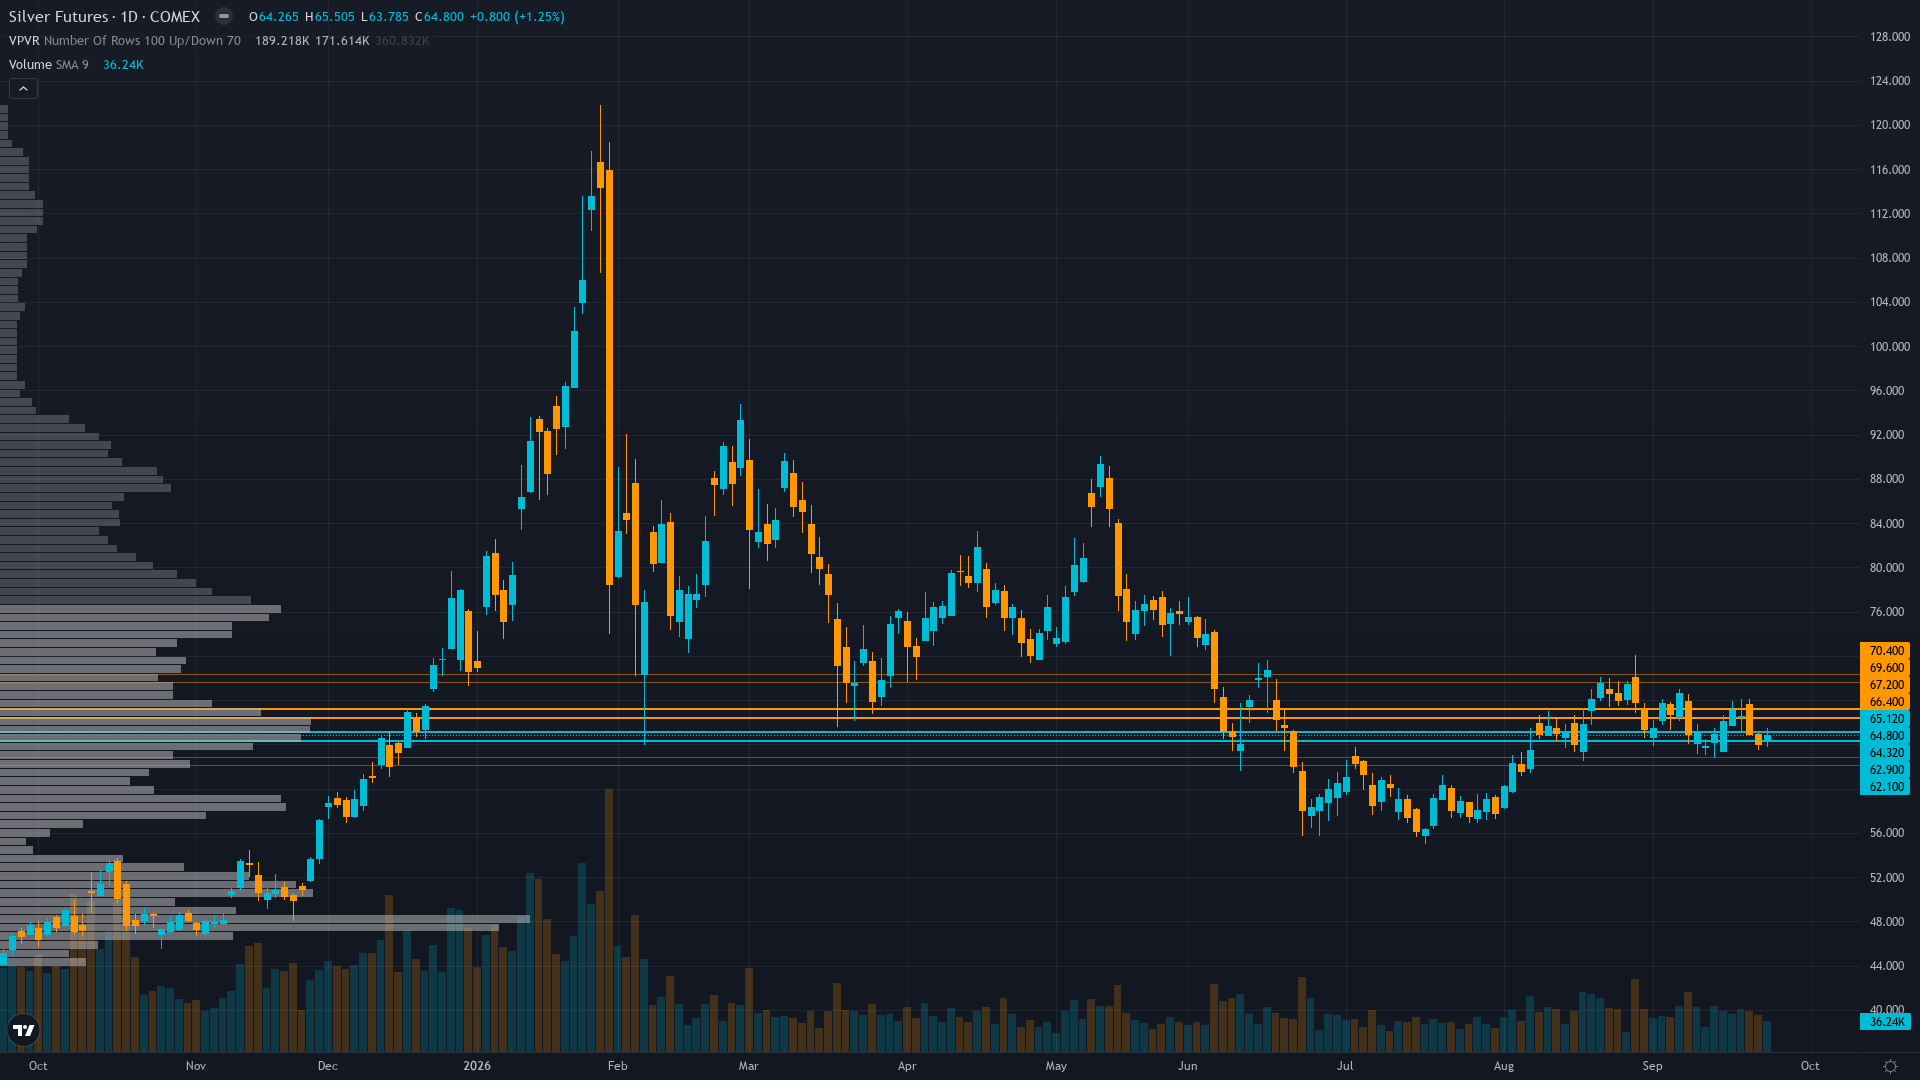
Trading at 64.245 with a 0.68% uptick, silver is drifting higher without strong conviction. The market in silver futures is coiling, with narrowing price ranges suggesting stored energy that will eventually release.
Market consensus is fractured between structural deficit bulls who argue $64 silver is deeply undervalued given six consecutive years of physical deficit and institutional positioning at the 27.8th percentile, and near-term bears who see further downside to $60-62 as elevated real yields (10Y at 5.17%) continue to suppress non-yielding precious metals — CoinCodex projects flat to slightly lower at $64.18 by Oct 2, reflecting the lack of clear directional conviction
Key Drivers This Week
Primary driver: Rising real yields (10Y Treasury at 5.17%, up 16bp in the past week) continue to suppress silver's paper price through the real-yield mechanism, overwhelming the structural physical deficit thesis for a sixth consecutive month as the market digests the hawkish post-FOMC dot plot signals
Secondary factor: Structural deficit thesis remains intact for the sixth consecutive year (46.3M oz 2026 shortfall per Silver Institute) with cumulative above-ground stock drawdown of 762M oz since 2021, but the real-yield headwind from elevated Treasury yields at 5.17% keeps the paper-gold-silver ratio near 68:1, well above the 2% floor that would imply $88/oz at current gold prices
Additional influence: Institutional positioning at the 27.8th percentile of the 3-year range (CFTC COT Sep 22, non-commercial net 25,444 contracts) remains profoundly under-positioned for the structural deficit thesis, providing asymmetric upside fuel if the real-yield headwind eases, but silver ETF outflows continue while gold ETFs attracted $2B in September, indicating institutional preference for gold over silver
Economic backdrop: TRANSITIONAL DIVERGENT regime: VIX at 14.87 signals equity market complacency while precious metals face sustained real-yield headwinds from 10Y Treasury at 5.17% (+16bp weekly), Fed funds at 3.63% with futures pricing additional hikes to ~4.2% by December, inflation at 2.34% stable, unemployment at 4.1%, consumer sentiment declining to 51.7 — upcoming catalysts include JOLTs Job Openings (Sep 29), CB Consumer Confidence (Sep 29), and multiple Fed speeches this week
Fundamental assessment: Silver appears moderately undervalued at $64.25/oz trading 44% below its 52-week high of $115.08 despite a sixth consecutive annual supply deficit of 46.3M oz, but near-term pricing remains hostage to real yields with 10Y at 5.17% creating a direct headwind for non-yielding assets that overwhelms the structural scarcity narrative
Price Structure
Silver consolidating in a $62.50-$66.00 range after the weekly sell-off from $66.56 to $64.25, with RSI at 47 indicating balanced momentum, volume thinning on the Sep 24 sell-off to $63.41 suggesting weak selling conviction, and price holding above the $62.50 support zone but failing to challenge $66 resistance
Trend strength registers just 3/10, which typically corresponds to choppy, directionless price action.
Volatility Regime
Volatility for silver price is at the 55th percentile over 90 days — a normal regime that allows for standard position sizing and conventional trade management. The vol trend is down, with contraction across timeframes creating the kind of coiled conditions that historically resolve explosively.
High vol regime with 33.6% annualised vol and daily ranges of 2-4% requires stops 6-8% below entry; the $62.50-$66.00 near-term range provides defined-risk breakout levels with the post-FOMC consolidation offering mean reversion potential; wide stops are necessary given silver's 5.79% average weekly move
Bull & Bear Case
Primary risk: A sustained rally in 10-year Treasury yields above 5.25% driven by hawkish Fed speeches this week (Bowman, Barkin, Goolsbee, Williams, Waller all speaking Sep 28-29) would reassert the real-yield headwind, potentially triggering a breakdown below $62.50 support toward the $60.00 psychological level as institutional positioning at the 27.8th percentile provides no floor and silver ETF outflows accelerate (Probability: medium)
Primary opportunity: If this week's economic data (JOLTs, Consumer Confidence) shows softening and Fed speakers strike a less hawkish tone than the market expects, the real-yield headwind could ease, enabling a recovery rally from the oversold $62.50-$64.00 zone toward $66-$68 resistance, with institutional positioning at the 27.8th percentile providing asymmetric upside fuel as under-positioned specs re-enter, supported by the structural deficit thesis and gold-silver ratio near 68:1 that implies material undervaluation (Timeframe: 1-3 weeks through the October 14 CPI report if economic data softens and real-yield pressure eases, enabling institutional re-positioning from the 27.8th percentile toward neutral positioning)
This week's edge: Below noise threshold — range-bound assessment: the weighted discipline signal of +0.15 is well below the 0.8 Min Signal for PRECIOUS_METAL, the 2-3 discipline split (Fundamental bullish vs Economic/Technical/Institutional bearish) creates no actionable edge, and the measured calibration shows all COMMODITY disciplines near coin-flip accuracy — this is a low-information-edge environment where the most disciplined call is no call
Week Ahead Outlook
CB Consumer Confidence (Sep) at 2:00 PM ET with estimate 90 vs prior 89.4, followed by JOLTs Job Openings (Aug) at the same time with estimate 7.23M vs prior 7.271M — both provide reads on consumer health and labor market tightness that influence Fed trajectory expectations on Tuesday 29 September is the next scheduled catalyst, with moderate potential to influence near-term price action.
For SI futures, the balance between existing momentum and scheduled risk events sets the stage for the week ahead.
This analysis covers one dimension. Our full weekly report combines six specialist agents into a single actionable briefing with directional bias, key levels, and risk-opportunity matrix.
Start Free — Get the Market of the WeekFree weekly report · No credit card · Upgrade anytime