Silver Forecast This Week — Outlook, Drivers & Key Levels
This week's Silver outlook: key drivers, volatility context, risk-opportunity assessment and the week ahead.

This Week's Starting Point
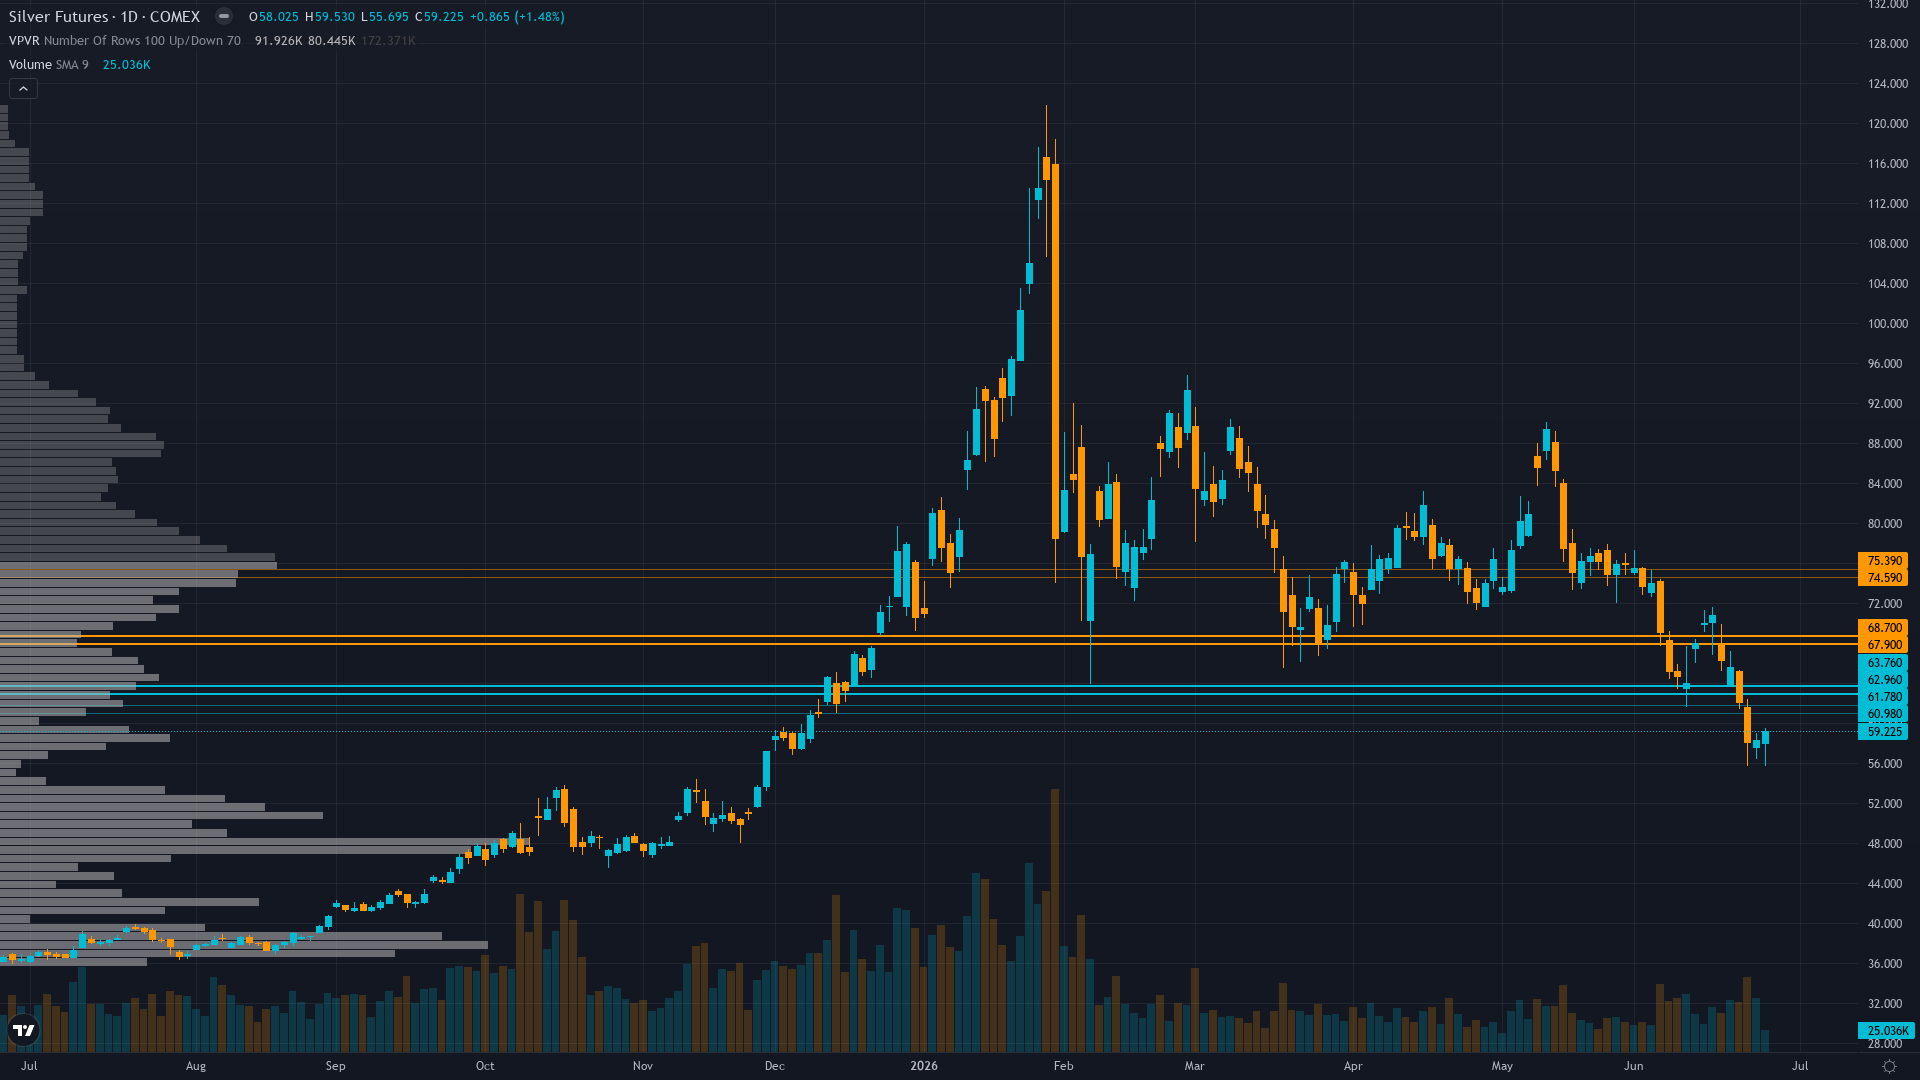
silver is trading at 59.18, up 1.47% in the last 24 hours as buyers maintain control. silver futures is in a breaking down market state, requiring careful assessment of current conditions.
Market consensus fractured between structural deficit bulls targeting $70-85 recovery post-July FOMC on intact sixth-year deficit fundamentals and bearish technicians projecting $50-55 test if 200-day MA fails, with CoinCodex algorithm predicting -12.16% decline to $51.67 by July 4 suggesting bearish algorithmic lean while broader sentiment remains cautious awaiting July 30-31 FOMC clarity
Forces in Play
Primary driver: Sixth consecutive CORRECT BEARISH call validated as price crashed -8.83% this week from $64.91 to $59.18, driven by June 17 Fed Chair Warsh hawkish pivot removing forward guidance and dot plot signaling potential rate hikes sustaining real yields above 2.0% and dollar strength (DXY 13-month highs) overwhelming sixth-year structural deficit fundamentals
Secondary factor: Technical breakdown accelerating below critical $61.38 200-day MA with price at $59.18 now testing $55.70 intraday low support, RSI 42 bearish momentum, and Fortune/Trading Economics documenting silver fell below $60 for first time since December 2025 marking 53% decline from January $121.79 all-time high
Additional influence: Managed money positioning at 9,794 contracts (25-35th percentile) after January-June washout creating washed-out institutional landscape with SLV outflows -9.32% AUM continuing, while sentiment transitioning OUT of euphoria toward fear (CNN F&G 25) suggests contrarian setup emerging but requires Fed dovish catalyst to reverse dollar weakness
Economic backdrop: Fed hawkish pivot June 17 FOMC (11 days ago) represents fresh catalyst as Chair Warsh removed dovish forward guidance and dot plot shows potential rate hikes, May CPI at 4.17% headline (8.20% annualized over 3 months) shows inflation acceleration, real yields elevated creating headwind, DXY at 13-month highs, VIX 18.89 below 20 indicating technical risk-on yet precious metals selling sharply
Fundamental assessment: Sixth consecutive year of 46.3M oz structural deficit with industrial demand consuming record 59% of supply from solar/EV/AI sectors unchanged per Silver Institute, fundamentally constructive medium-term but near-term overwhelmed by Fed monetary policy headwinds with real yields elevated and dollar strength creating mathematical headwind for non-yielding assets
Technical Landscape
Sharp downtrend accelerating with price at $59.18 breaking below 200-day MA at $61.38 and approaching $55.70 June intraday low, trading 22% below 50-day MA ($76) and 10% below 200-day, RSI 42 bearish momentum not yet oversold, breakdown structure confirmed with lower highs and lower lows since January $121.79 peak
Trend strength is low at 2/10, indicating weak directional conviction and potential for range-bound behaviour.
Risk-Reward Assessment
Primary risk: Breakdown below $55.70 support triggering cascade toward $50 psychological level if July 30-31 Warsh FOMC reinforces hawkish stance or June/July inflation data reaccelerates above 4.5% validating Fed June 17 hawkish pivot, sustaining real yields above 2.20% and DXY above current levels forcing remaining positioning to capitulate despite sixth-year structural deficit fundamentals (Probability: medium)
Primary opportunity: Successful defense of $55.70-59 support zone establishes foundation for recovery toward $64-68 resistance if July inflation data moderates below 3.5% enabling Fed at July 30-31 FOMC to signal less hawkish stance weakening dollar below DXY 100 and driving real yields below 2.0%, allowing sixth-year structural deficit with 59% industrial demand to reassert while washed-out institutional positioning at 9,794 contracts provides upside fuel (Timeframe: 4-6 weeks through July 30-31 FOMC if inflation trajectory cooperates enabling Fed dovish tilt)
This week's edge: Market treating June 17 Warsh FOMC hawkish pivot as standard hold event with incremental policy adjustment, while desk recognizes Warsh's removal of dovish forward guidance and increased hawkish member projections creates asymmetric sustained dollar strength risk that consensus underprices—current $59.18 approaching $55.70 support represents genuine inflection where breakdown triggers 6-10% cascade toward $50-53 but structural deficit provides fundamental floor that panic models underestimate, creating tactical shorting opportunity with defined risk while acknowledging six consecutive correct calls validate monetary policy dominance thesis
Risk Environment
With vol at the 82th percentile, silver price is trading in an elevated regime where daily ranges can surprise even experienced traders. Volatility is stable, with realised vol holding steady across timeframes. This equilibrium can persist but eventually resolves into expansion or contraction.
High volatility at 82nd percentile requires stops 12-18% below entry versus normal 4-6% with daily ranges now 5-9% versus typical 2-3%, making intraday swings volatile but directional conviction viable; breakdown below $55.70 becomes reliable continuation signal toward $50-53 if sustained 2+ days, while successful hold above $58 with declining volatility signals potential bottom formation though resistance at $64-68 remains formidable
Looking Forward
All eyes turn to Federal Reserve July 30-31 FOMC meeting expected to hold rates at 3.50-3.75% with focus on whether Warsh maintains hawkish stance from June 17 meeting or acknowledges inflation moderation enabling dovish shift, critical inflection for whether Fed signals policy flexibility weakening dollar or reinforces restrictive stance sustaining real yield pressure on Thursday 30 July, which carries enough weight to force a decisive directional move.
The week ahead for silver futures hinges on whether the prevailing breaking down regime can absorb the scheduled catalysts without a regime shift.
This analysis covers one dimension. Our full weekly report combines six specialist agents into a single actionable briefing with directional bias, key levels, and risk-opportunity matrix.
Start Free — Get the Market of the WeekFree weekly report · No credit card · Upgrade anytime