Silver Forecast This Week — Outlook, Drivers & Key Levels
This week's Silver outlook: key drivers, volatility context, risk-opportunity assessment and the week ahead.

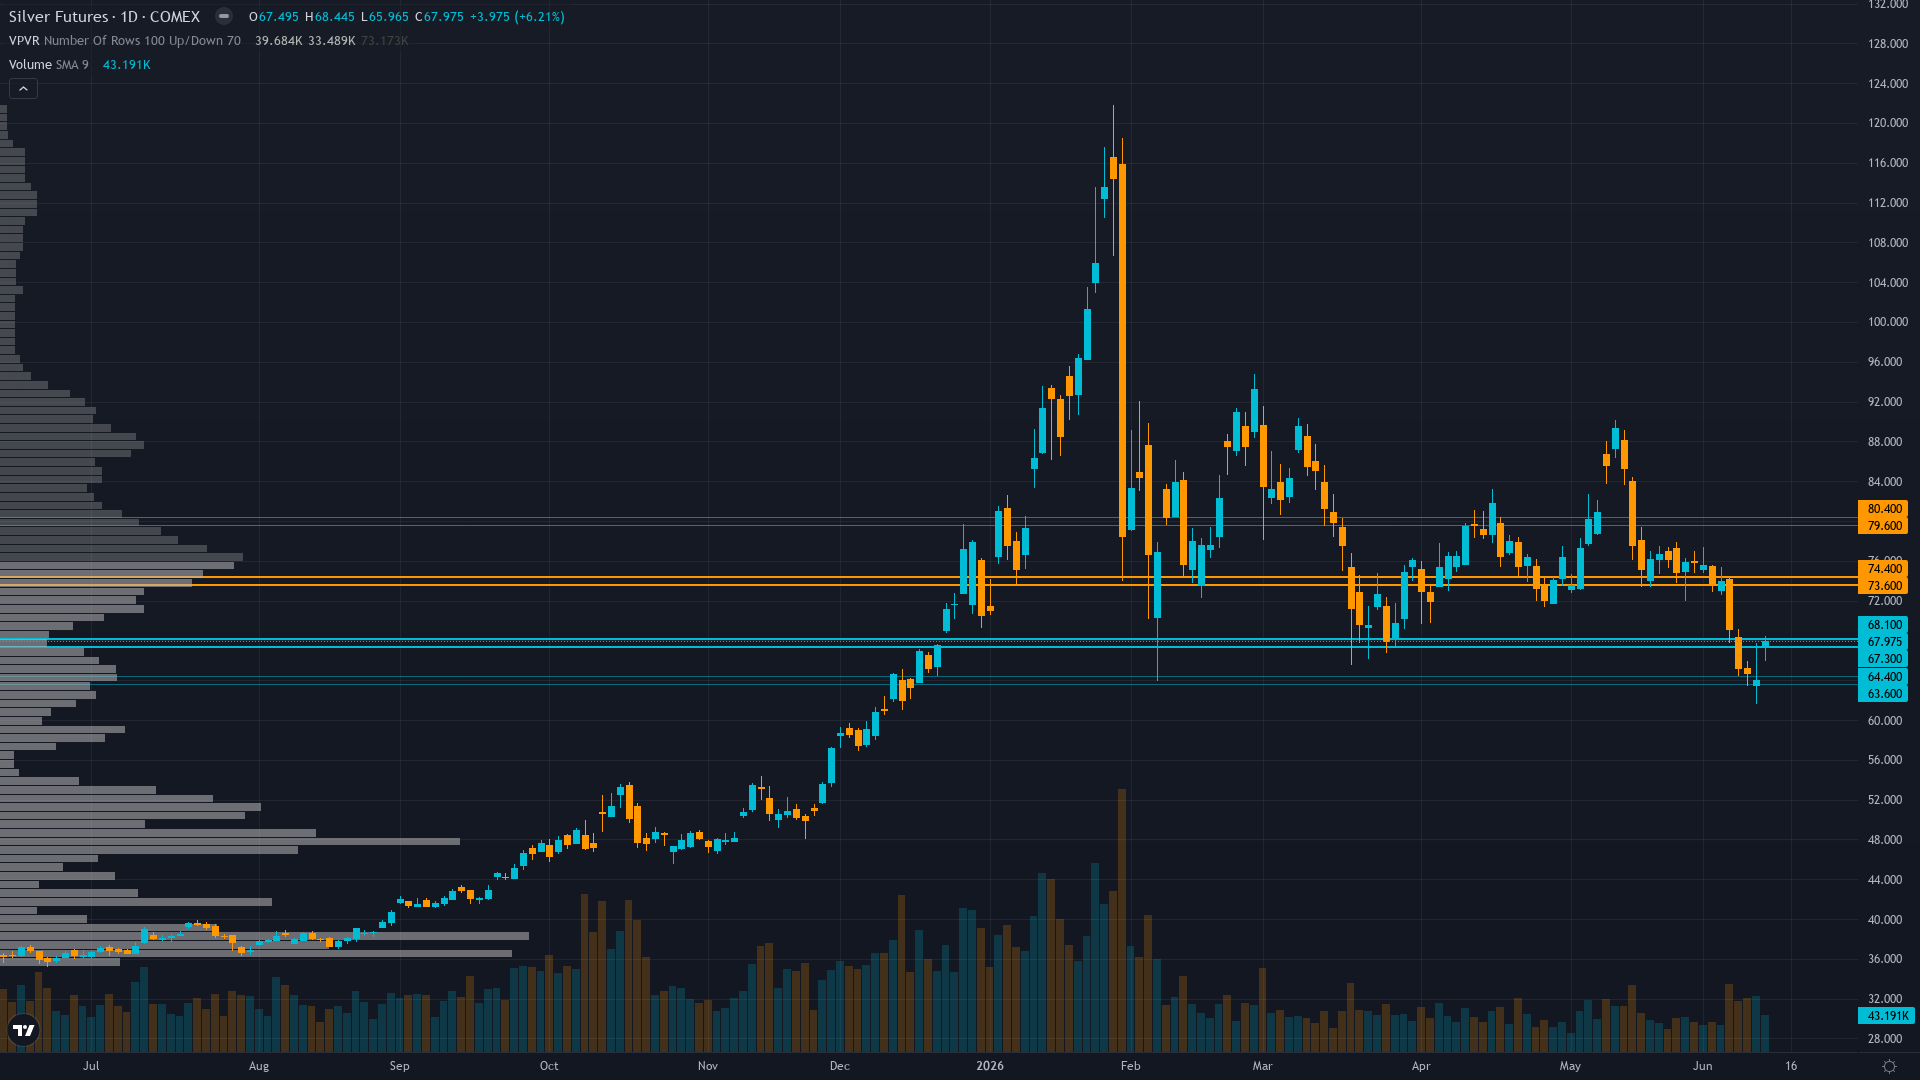
Where Things Stand
silver sits at 68 after slipping 0.60% — a shallow pullback rather than a decisive move. silver futures is in a breaking down market state, requiring careful assessment of current conditions.
Market consensus fractured between structural bulls targeting $75-85 recovery post-FOMC on intact sixth-year deficit fundamentals and bearish technicians projecting $61-64 test if 200-day MA fails, with CoinCodex algorithm predicting +2.28% to $69.55 by June 19 suggesting modest algorithmic bullish lean post-FOMC while broader sentiment remains cautious awaiting Warsh's dot plot clarity
What's Driving Price
Primary driver: Price at $68 testing critical 200-day MA support ($68.09) just 48 hours before Kevin Warsh's first FOMC as Fed Chair (June 16-17), with silver down 44% from January $121.64 ATH as hawkish dot plot expectations sustain real yields at 2.17% creating mathematical headwind for non-yielding assets despite sixth consecutive year of 67M oz structural deficit remaining fundamentally intact
Secondary factor: June 16-17 FOMC represents binary catalyst with market pricing 99% probability of hold at 3.5-3.75% but focused on whether Warsh's dot plot shows zero 2026 cuts versus prior one-cut projection and whether he removes easing bias from statement, creating asymmetric downside risk if hawkish while structural deficit provides floor above $64-65
Additional influence: Four consecutive CORRECT bearish calls validating desk's thesis that Fed monetary policy trajectory overwhelms structural fundamentals near-term, with managed money positioning at mid-range 10k contracts after washout limiting forced liquidation risk but retail positioning likely still elevated creating vulnerability if $68 200-day MA fails triggering cascade toward $61-64 major support
Economic backdrop: Fed at 3.5-3.75% after April hold, June 16-17 FOMC 2 days away represents Kevin Warsh's first meeting as Chair with critical dot plot risk, May CPI at 4.2% headline/2.9% core shows sticky inflation, real yields at 2.17% elevated, DXY 99.81 weakening slightly but USD strength cycle intact, VIX 21.51 transitional regime, market pricing 99% hold but focus on whether dot plot removes remaining 2026 cut and whether Warsh abandons easing bias
Fundamental assessment: Sixth consecutive year of 67M oz structural deficit (some sources 46.3M oz) with industrial demand 650M oz at 59% of supply from solar/EV/AI fundamentally constructive medium-term but near-term overwhelmed by monetary policy headwinds, current $68 trades 20-25% below fair value estimates of $80-90 per Fundamental Agent yet deficit narrative cannot override real yields at 2.17% and DXY dollar strength
Chart Assessment
Testing critical 200-day MA support at $68.09 after 44% decline from January $121.64 ATH, trading below 50-day MA ($76.38) and 20-day MA ($77.31), RSI 35-41 bearish momentum without oversold extremes, breakdown structure confirmed with lower highs and lower lows, immediate support $65 then major $61, resistance $72 immediate then $76-78 major
With trend strength at only 2/10, any directional bias is thin and easily disrupted.
Risk & Opportunity
Primary risk: June 17 Warsh FOMC removes remaining 2026 cut from dot plot and eliminates easing bias from statement, sustaining real yields above 2.0% and reinforcing hawkish Fed stance through year-end, triggering breakdown below $65 toward $61-64 major support zone as retail capitulation accelerates and sixth-year structural deficit narrative fails to provide floor in face of sustained monetary policy headwinds (Probability: medium)
Primary opportunity: Current $68 level at 200-day MA represents oversold extreme after 44% decline from January peak with institutional positioning already washed-out at mid-range creating asymmetric recovery potential if June 17 Warsh FOMC maintains one 2026 cut in dot plot or signals inflation moderation acknowledgment, weakening dollar below DXY 96 and allowing sixth-year structural deficit with 59% industrial demand to reassert driving recovery toward $72-76 resistance (Timeframe: 2-4 days post-June 17 FOMC through following week if Fed provides less hawkish guidance than market fears)
This week's edge: Market treating June 16-17 Warsh FOMC as standard hold event with modest dot plot adjustment risk, while desk recognizes Warsh's documented intent to fundamentally alter Fed communication framework (potentially abstaining from dot plot, removing easing bias per Reuters/CNBC/Chase sources) creates asymmetric hawkish surprise risk that consensus underprices — current $68 at 200-day MA represents genuine inflection where breakdown triggers 10-12% cascade toward $61-64 but structural deficit provides fundamental floor that panic models underestimate, creating tactical shorting opportunity with defined risk
Looking Forward
All eyes turn to Federal Reserve June 16-17 FOMC meeting — Kevin Warsh's first as Fed Chair — expected to hold rates at 3.5-3.75% with 99% probability, but critical binary catalyst is whether dot plot removes last remaining 2026 rate cut projection and whether Warsh signals regime change by potentially abstaining from dot plot entirely or removing easing bias from statement per Reuters/CNBC reporting, with statement and press conference at 2:00pm ET June 17 on Wednesday 17 June, which carries enough weight to force a decisive directional move.
The week ahead for silver hinges on whether the prevailing breaking down regime can absorb the scheduled catalysts without a regime shift.
This analysis covers one dimension. Our full weekly report combines six specialist agents into a single actionable briefing with directional bias, key levels, and risk-opportunity matrix.
Start Free — Get the Market of the WeekFree weekly report · No credit card · Upgrade anytime


