Silver Forecast This Week — Outlook, Drivers & Key Levels
This week's Silver outlook: key drivers, volatility context, risk-opportunity assessment and the week ahead.

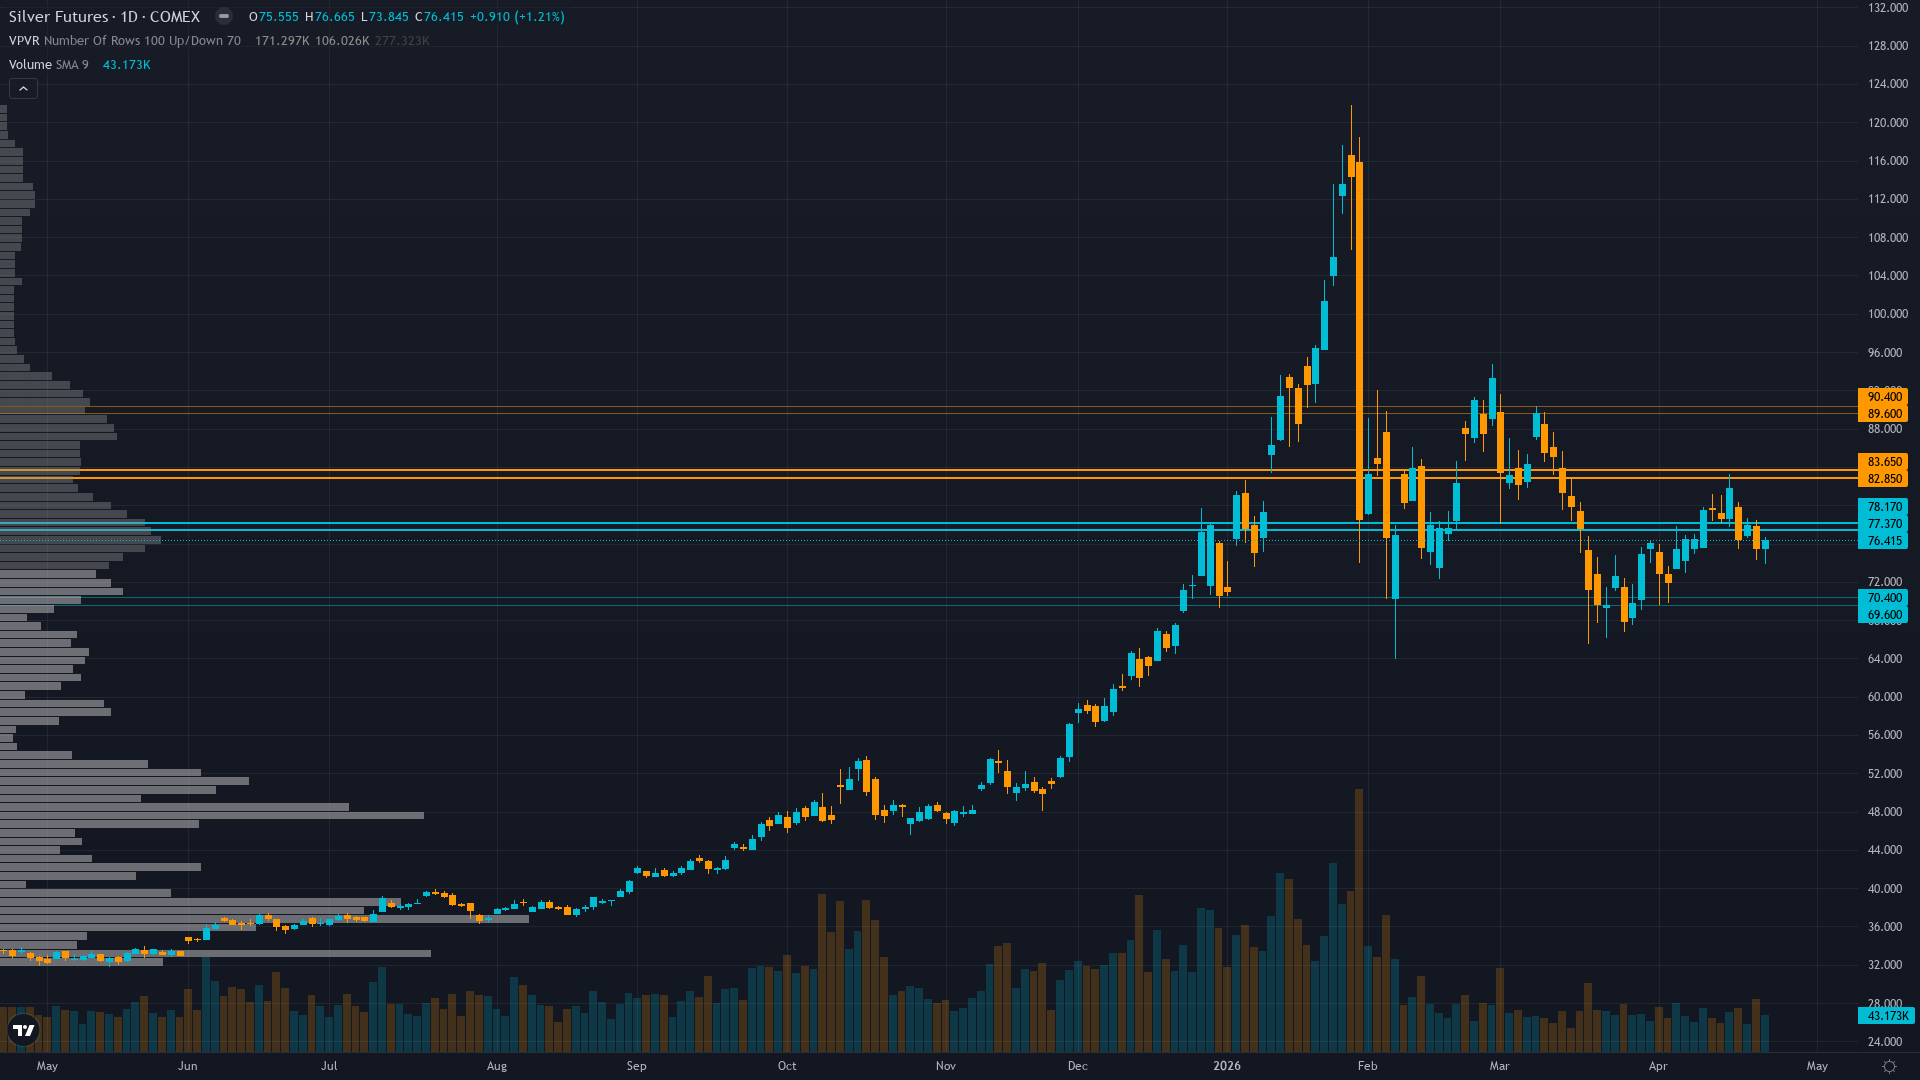
This Week's Starting Point
silver is trading at 76, down 1.20% as selling pressure weighs on price. Price action in silver futures has compressed into a consolidation pattern, typically a precursor to a directional breakout.
Market consensus fractured between structural bulls targeting $80-90 recovery post-FOMC on intact sixth-year deficit fundamentals and cautious neutrals awaiting April 29 Fed clarity with GoldSilver.com noting gold near $4,707 ahead of FOMC suggests precious metals complex in defensive positioning ahead of binary event
Forces in Play
Primary driver: Last week's BULLISH call at conviction 7 MISSED with price falling -7.4% from $81.84 to $75.785 as FOMC week uncertainty and Middle East tensions (Strait of Hormuz blockage keeping energy prices elevated) drove dollar strength and precious metals weakness, triggering mandatory conviction penalties and defensive repositioning ahead of April 29 binary catalyst
Secondary factor: Silver Institute April 15 confirmation of sixth consecutive year of 67M oz structural deficit with 59% industrial demand remains fundamentally constructive at $73-76 levels representing 15-20% discount to fair value estimates, but near-term overwhelmed by Fed policy uncertainty with April 29-30 FOMC 3 days away creating unacceptable two-way risk
Additional influence: Extreme retail positioning at 82.2% long (Capital.com April 21 data) combined with SLV institutional outflows (-9.32% AUM) and managed money at mid-range 45-55th percentile creates contrarian bearish overhang where further downside from forced liquidation possible if FOMC delivers hawkish surprise sustaining real yields above 2.0% and DXY strength
Economic backdrop: Fed April 29-30 FOMC meeting 3 days away expected to hold rates at 3.50-3.75% with market focus on forward guidance and inflation commentary, VIX at 19.02 (risk-on regime below 20), 10Y yield 4.31% with real yields 1.73% creating headwind for non-yielding assets, March CPI +3.1% YoY shows sticky inflation, Middle East Strait of Hormuz blockage keeping energy prices elevated and inflation risks present
Fundamental assessment: Sixth consecutive year of 67M oz structural deficit with 59% industrial demand from solar/EV/AI sectors unchanged per Silver Institute April 15 report, fundamentals constructive medium-term at $73-76 representing 15-20% discount to fair value but overwhelmed near-term by monetary policy headwinds with real yields at 1.73% and Fed hold expected April 29
Technical Landscape
Failed breakdown below $73.50 support but unable to reclaim $81 50-day MA after rejection, consolidating in $73-78 range with RSI 44.64 neutral, price 5.9% below 50-day MA at $81.17 but 27.8% above 200-day at $59.84 indicating medium-term uptrend intact though near-term momentum negative
Trend strength sits at 4/10, reflecting moderate directional pressure without clear dominance.
Risk-Reward Assessment
Primary risk: FOMC April 29-30 delivers hawkish surprise reinforcing restrictive stance interpreting March 3.1% CPI and Middle East energy disruption as sustained inflation reacceleration not transitory shock, sustaining real yields above 2.0% and DXY above 100, triggering breakdown below $73.50 toward $70 psychological support as extreme retail positioning at 82.2% long forced to capitulate and miss streak extends to 2 consecutive (Probability: medium)
Primary opportunity: FOMC April 29-30 acknowledges March CPI spike as transitory energy shock with core inflation moderating, signaling June rate cut possibility and weakening dollar below DXY 96, enabling recovery toward $80-82 resistance as sixth-year structural deficit fundamentals reassert, washed-out institutional positioning provides upside fuel, and failed breakdown at $73.50 validates support creating platform for reversal (Timeframe: 2-4 weeks post-FOMC through mid-May if Fed provides dovish catalyst weakening dollar and driving real yields below 1.90%)
This week's edge: Market treating April 24-26 consolidation at $73-76 as extended correction requiring Fed dovish pivot to resume uptrend, while desk recognizes successful $73.50 support defense as critical validation that sixth-year deficit with 59% industrial demand creates fundamental floor—however, last week's MISSED BULLISH call, extreme retail positioning at 82.2% long, binary FOMC risk 3 days away, and absence of fresh catalysts this week force defensive neutral-to-bearish stance at minimum conviction 5 until thesis health restores or Fed provides directional clarity April 29
Risk Environment
With vol at the 82th percentile, silver price is trading in an elevated regime where daily ranges can surprise even experienced traders. Volatility is stable, with realised vol holding steady across timeframes. This equilibrium can persist but eventually resolves into expansion or contraction.
High volatility at 82nd percentile ahead of binary FOMC event requires stops 12-18% below entry versus normal 4-6% with daily ranges now 5-7% versus typical 2-3% making pre-event directional calls unreliable; breakout above $78.50 post-FOMC becomes reliable continuation signal toward $82-85 if dovish, while failure below $73.50 accelerates correction risk to $70-72 if hawkish
Looking Forward
All eyes turn to Federal Reserve April 29-30 FOMC meeting expected to hold rates unchanged at 3.50-3.75% with critical focus on Chair Powell press conference forward guidance addressing remainder of 2026 rate path, inflation trajectory assessment, and whether March CPI spike viewed as transitory energy shock or sustained reacceleration requiring prolonged restrictive stance on Wednesday 29 April, which carries enough weight to force a decisive directional move.
The week ahead for silver futures hinges on whether the prevailing consolidating regime can absorb the scheduled catalysts without a regime shift.
This analysis covers one dimension. Our full weekly report combines six specialist agents into a single actionable briefing with directional bias, key levels, and risk-opportunity matrix.
Start Free — Get the Market of the WeekFree weekly report · No credit card · Upgrade anytime


