Silver Forecast This Week — Outlook, Drivers & Key Levels
This week's Silver outlook: key drivers, volatility context, risk-opportunity assessment and the week ahead.

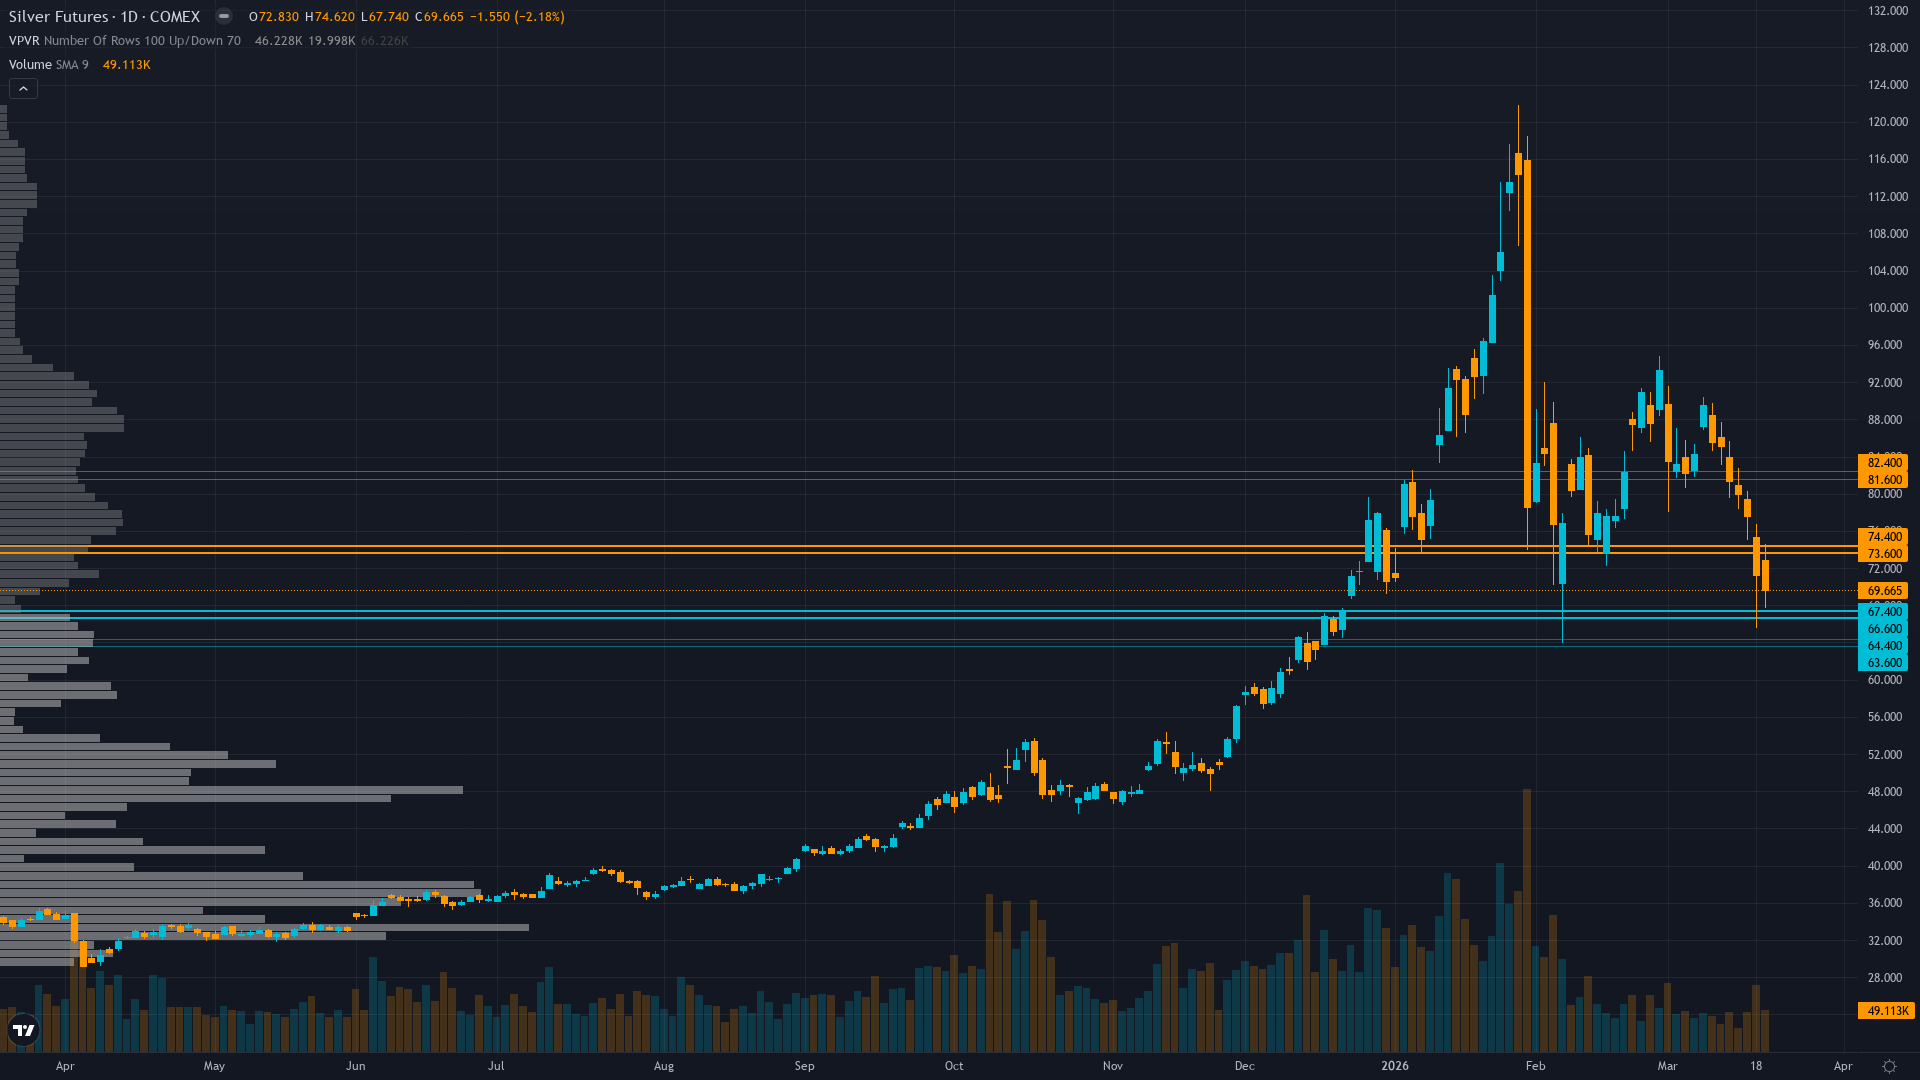
Where Things Stand
silver sits at 69.66, having shed 2.50% as bears maintain the upper hand. silver futures is in a breaking down market state, requiring careful assessment of current conditions.
Market consensus fractured between structural bulls targeting $75-85 consolidation and capitulation bears projecting $60-65 test, with CoinCodex algorithm predicting -7.96% decline to $74.20 by March 26 though this forecast predates the March 18-20 hawkish Fed shock
What's Driving Price
Primary driver: Federal Reserve March 18 hawkish hold with dot plot showing only ONE 2026 rate cut versus market expectations triggering dollar strength to DXY 107+ and real yields spiking above 2.0%, crushing non-yielding precious metals in worst weekly selloff since 2011
Secondary factor: Cascading institutional liquidation with SLV ETF bleeding assets (9.32% decline) and managed money positioning unwind accelerating from already-washed-out levels creating technical breakdown below critical $70-72 support zone
Additional influence: Extreme retail positioning remains stubbornly long (85.9% buyers) refusing to capitulate even after 43% decline from January peak to current $69.66, creating classic contrarian bearish setup as weak hands face forced liquidation
Economic backdrop: Fed March 18 hawkish hold with dot plot revision to ONE 2026 cut versus prior multiple-cut expectations drove 10Y TIPS real yields above 2.0% threshold, DXY dollar strength to 107+, creating perfect storm headwind for non-yielding assets compounded by Middle East geopolitical uncertainty
Fundamental assessment: Sixth consecutive year of 67M oz structural deficit with 59% industrial demand from solar/EV/AI sectors remains fundamentally intact, but near-term price action dominated by monetary policy shock overwhelming medium-term scarcity drivers
Chart Assessment
Breakdown below $70 psychological support accelerating with daily candles printing 6-8% declines, 50-day MA at $82.70 and 200-day near $60-65 both failing as technical anchors, RSI likely oversold but no reversal signal yet
With trend strength at only 3/10, any directional bias is thin and easily disrupted.
Risk & Opportunity
Primary risk: Further breakdown below $67 toward January flash crash lows near $64 if dollar sustains above DXY 107 and real yields hold above 2.0%, triggering cascading technical stops from remaining leveraged longs and forcing final capitulation from stubborn retail positioning at 85.9% long (Probability: medium)
Primary opportunity: Fed pivot signaling or softer-than-expected April employment data weakens dollar below DXY 105 and drives real yields back below 1.90%, creating V-shaped recovery toward $75-80 as washed-out institutional positioning and intact structural deficit enable sharp reversal (Timeframe: 2-4 weeks if macroeconomic data deteriorates forcing Fed reconsideration of hawkish stance by mid-April)
This week's edge: Market is treating March 18-20 precious metals rout as structural regime change invalidating the deficit narrative, while desk recognizes this as monetary policy-driven cyclical liquidation within intact secular bull structure—sixth year deficit with 59% industrial demand and China export weaponization controlling 60-70% supply suggests $64-70 zone represents oversold extremes relative to fundamentals, but requires Fed pivot catalyst or retail capitulation (positioning below 60% long vs current 85.9%) to trigger reversal; near-term edge is recognizing further downside to $64-67 more probable than V-recovery until capitulation extremes reached
Volatility Backdrop
silver price is in a high-volatility environment (89th percentile over 90 days), where position sizing discipline becomes critical. Volatility remains anchored at current levels, with no clear signal of an imminent regime shift in either direction.
Extreme volatility at 89th percentile requires stops 18-25% below entry versus normal 4-6% with daily ranges now 8-12% versus typical 2-3%, making directional calls highly unreliable for momentum strategies but creating mean-reversion opportunities at capitulation extremes—breakdown below $67 becomes reliable continuation signal toward $60-64 while reversal above $74 with declining volatility signals bottom formation
The Week Ahead
March NFP employment report and any Fed speaker commentary clarifying whether March 18 hawkish shift represents sustained policy stance or tactical pause on Friday 3 April is a high-impact catalyst with the potential to redefine the near-term outlook entirely.
How silver navigates the confluence of breaking down conditions and incoming data will determine whether the current directional thesis holds or breaks.
This analysis covers one dimension. Our full weekly report combines six specialist agents into a single actionable briefing with directional bias, key levels, and risk-opportunity matrix.
Start Free — Get the Market of the WeekFree weekly report · No credit card · Upgrade anytime


