Silver COT & Institutional Positioning — Smart Money Analysis
Silver institutional positioning: COT data, sentiment analysis and smart money flow assessment.

Where Institutions Stand
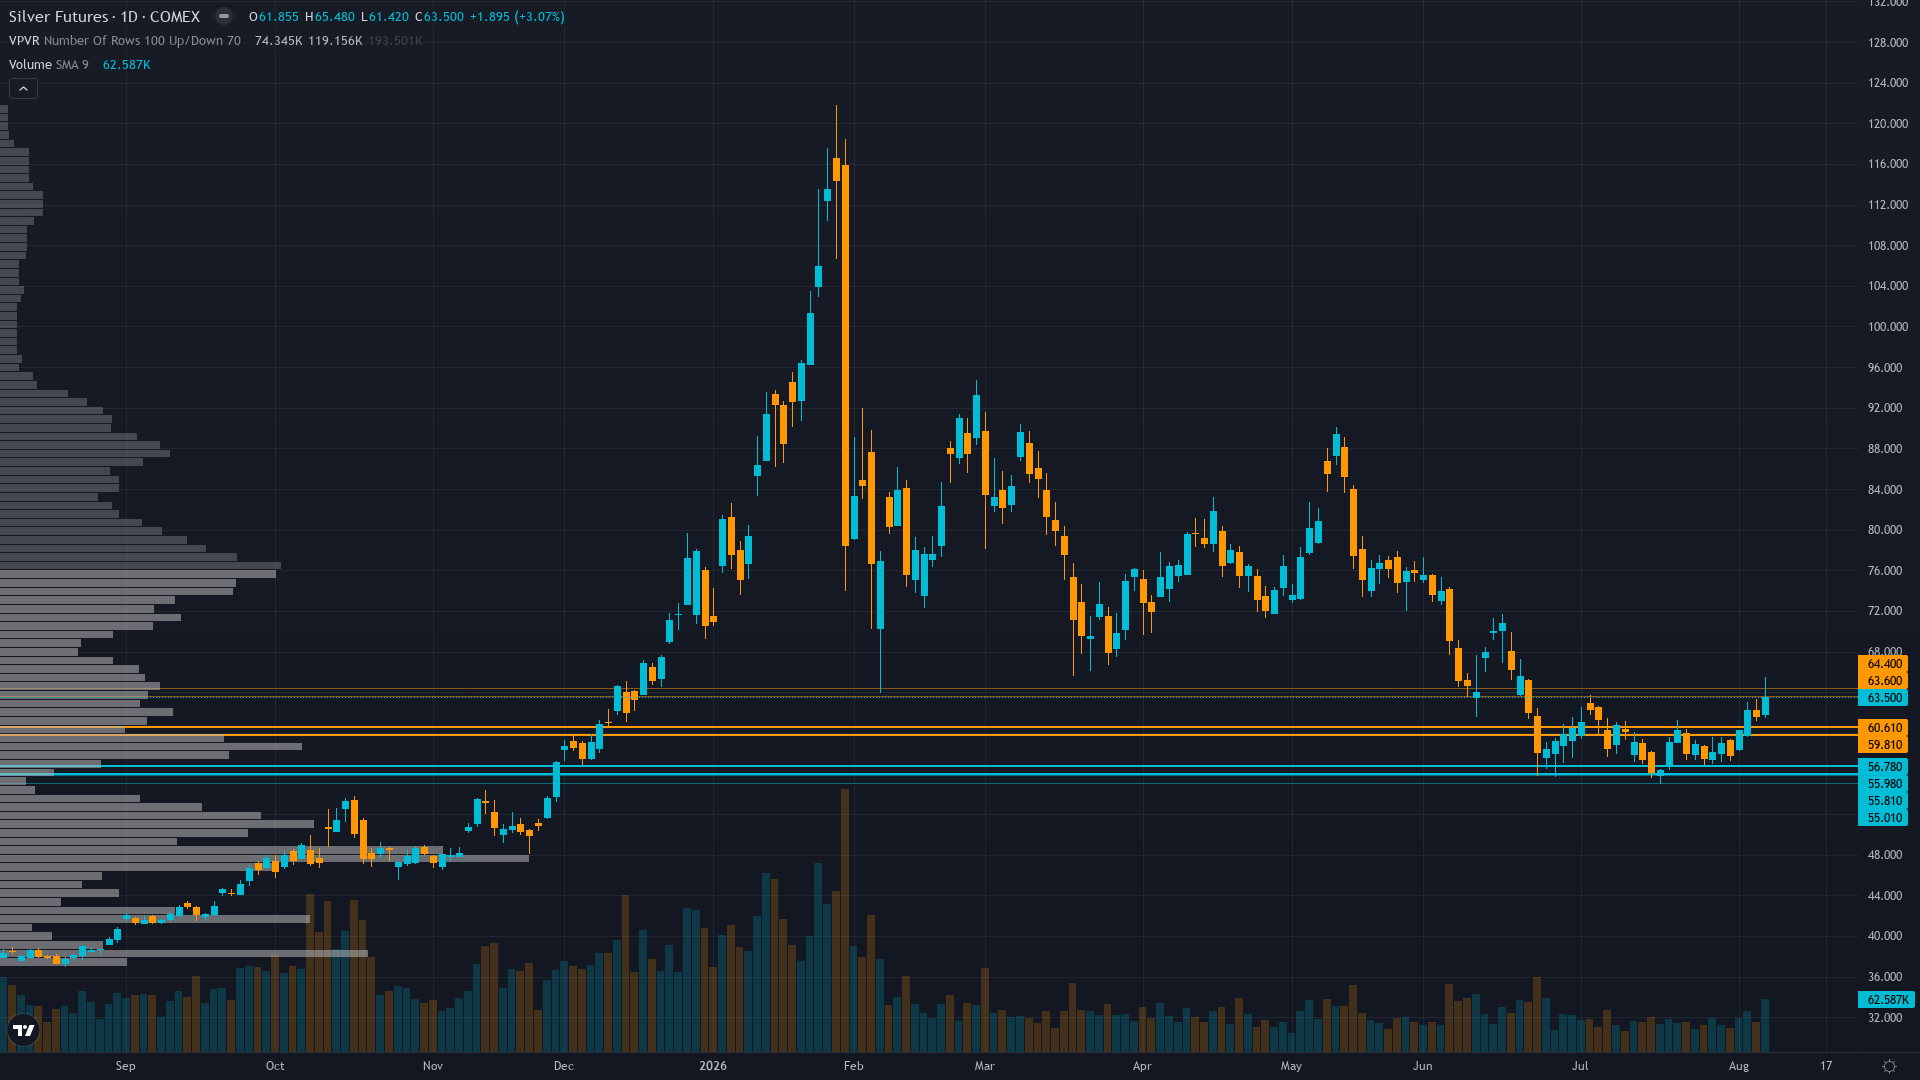
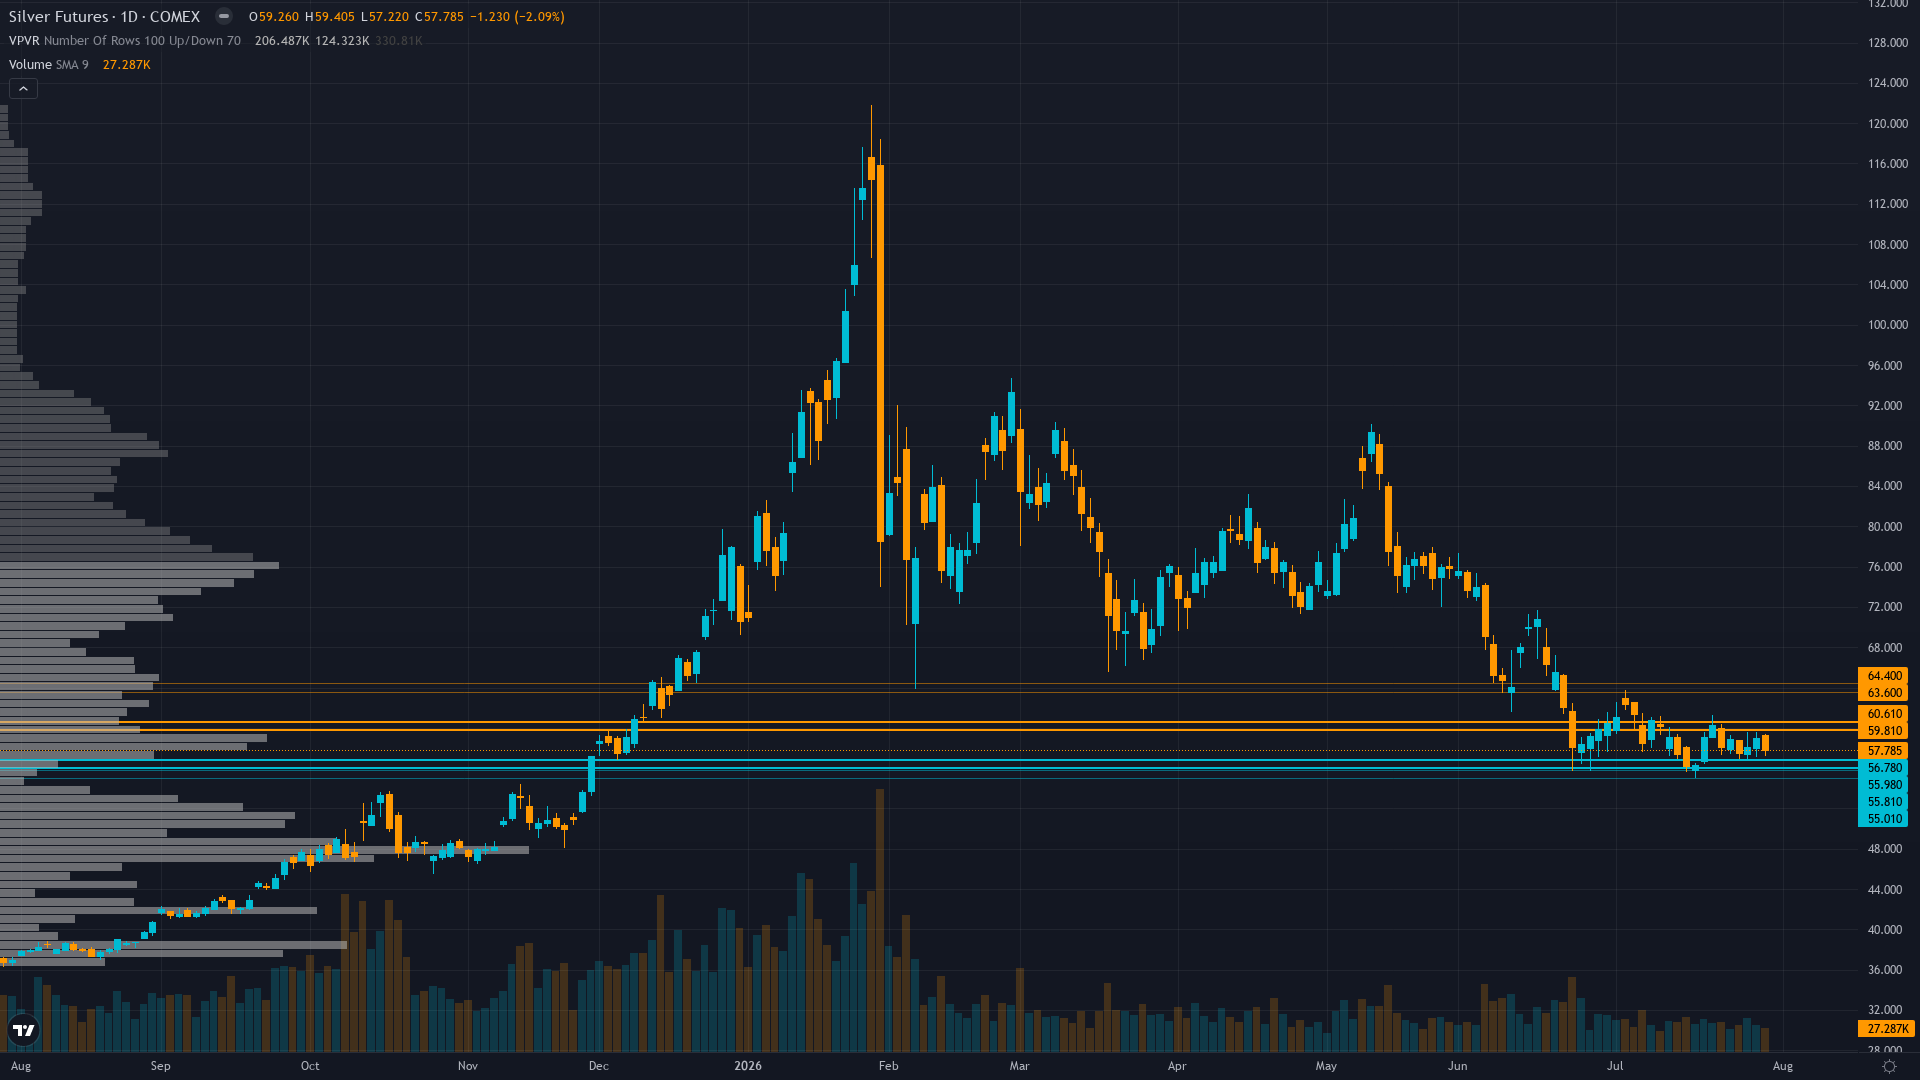
silver holds at 57.99, off 0.73% in a modest retracement from recent levels.
Managed Money net length contracted significantly from January extremes to estimated mid-range after washout per COT data through June, SLV ETF outflows persisting at -$381M 1-year with AUM down 18.4% past month, central bank gold buying 244 tonnes Q1 provides structural support but silver-specific flows remain defensive
Consensus vs MAD View
Market consensus: Market consensus fractured between structural deficit bulls seeing $63-65 August upside on seasonal tailwinds and weak labor data (ChatGPT projection $57-61 base case, $63-65 bullish case) versus algorithmic bears projecting -2.03% decline to $56.48 by August 8 (CoinCodex), with wide dispersion reflecting binary August 5 NFP uncertainty and lack of directional catalyst post-FOMC
Primary driver: Post-FOMC consolidation at $57-58 after July 29 Fed hold with 9-3 vote (3 hawkish dissenters) failed to provide directional catalyst, leaving silver range-bound between structural deficit floor ($55-56) and dollar/real yield ceiling ($60-61) awaiting Friday August 5 July nonfarm payrolls data
Where the Crowd May Be Wrong
Desk's mild bullish lean based on structural undervaluation (JPM $81/oz fair value vs $58 spot) and approaching August seasonal tailwinds diverges moderately from consensus bearish momentum and algorithmic forecasts projecting further decline to $56.48, with Fundamental Agent's valuation case being demonstrably underweighted by short-term focused market pricing
Crowd Psychology
Neither side has committed heavily to silver futures, leaving sentiment in a neutral zone that offers little directional guidance on its own.
Options Flow
Implied volatility data unavailable this cycle for SI futures options as of August 2, 2026; CBOE Silver ETF Volatility Index (VXSLV) at 50.36 reflecting elevated but not extreme vol regime; insufficient directional flow data for conviction; options weight remains minimal in precious metals framework
The Bottom Line on Positioning
The positioning mosaic for SI futures combines fear sentiment with contracting volatility conditions. Trend strength is low at 3/10, indicating weak directional conviction and potential for range-bound behaviour. Taken together, institutional behaviour, crowd psychology, and derivatives data frame the setup heading into the new week.
This analysis covers one dimension. Our full weekly report combines six specialist agents into a single actionable briefing with directional bias, key levels, and risk-opportunity matrix.
Start Free — Get the Market of the WeekFree weekly report · No credit card · Upgrade anytime