Russell 2000 Key Levels This Week — Support, Resistance & Confluence Zones
Russell 2000 key levels breakdown: support zones, resistance zones, confluence and price structure.

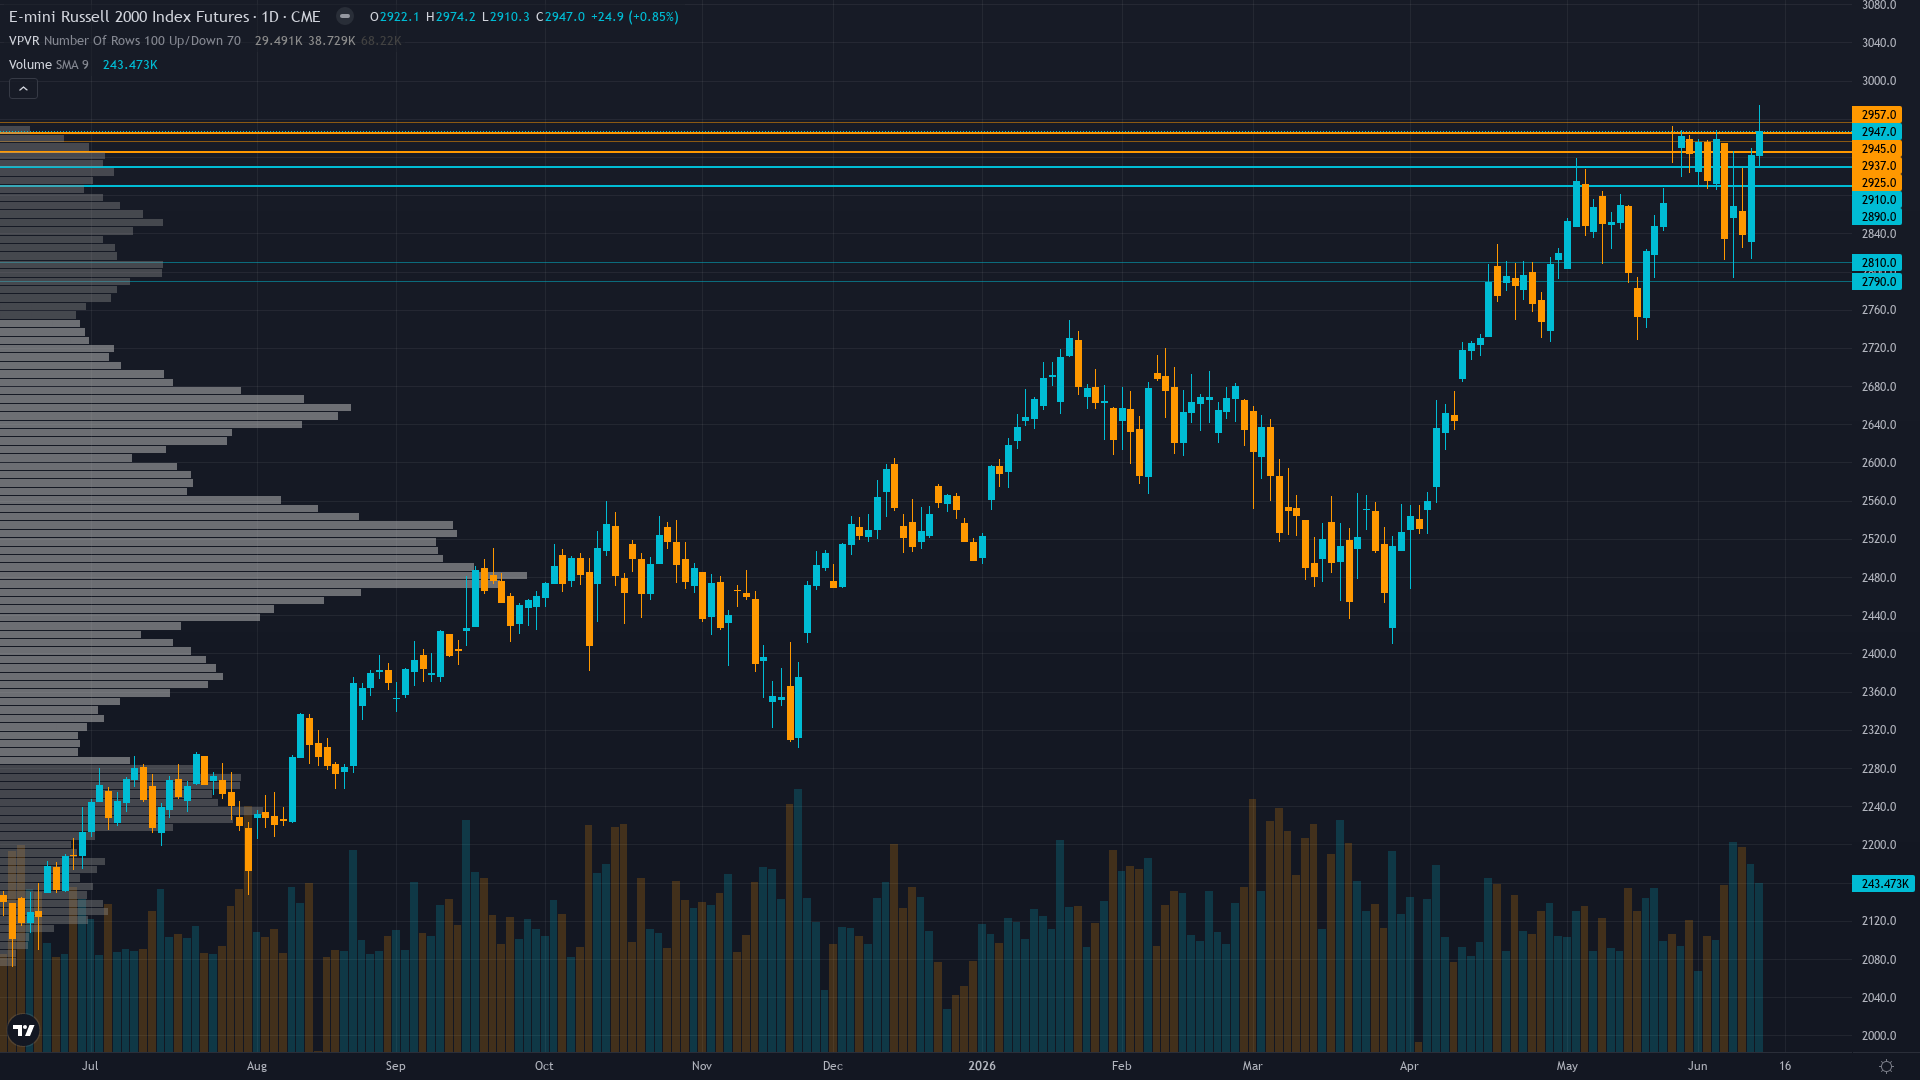
Where Price Sits
Russell 2000 holds at 2920.5, off 0.35% in a modest retracement from recent levels. Price action in Russell 2000 futures has compressed into a consolidation pattern, typically a precursor to a directional breakout.
Price at 2,920 consolidating 0.9% below May 27 all-time high of 2,947, holding constructive structure above 2,890 immediate support with RSI 34 oversold creating mean-reversion setup, uptrend intact above 50-day MA at 2,492 and 200-day at 2,564
Trend strength sits at 6/10, reflecting a market that has directional bias but hasn't reached extreme conviction.
Floors & Demand Zones
RTY futures has identifiable support zones below current price where buying interest has historically emerged. These zones represent areas where institutional participants have previously defended price, creating potential floors for pullbacks.
How effectively these zones hold depends on the prevailing regime and whether the volume profile confirms institutional participation.
Resistance Architecture
Above current price, Russell index encounters structural resistance defined by prior supply zones and profit-taking clusters. These barriers must be overcome convincingly for the upside thesis to develop.
The reliability of resistance depends on the number of touches and the volume traded at each level.
Multi-Agent Confluence
What separates high-probability levels from noise is multi-discipline agreement. The key zones for RTY futures are those where technical structure aligns with institutional positioning and options market activity.
Normal volatility regime at 45th percentile supports standard risk management with 2-3% stops below 2,860 support, expect 30-50 point daily ranges versus 60-100 during elevated volatility periods, stable pattern suggests consolidation environment until June 17 FOMC or June 26 reconstitution catalyst provides directional clarity with today's 17-point range confirming compression
The Intelligence Behind the Levels
Our multi-agent system analyses key levels from six perspectives simultaneously: technical structure identifies the zones, institutional positioning reveals where smart money is engaged, options flow shows where hedging clusters, fundamentals assess whether levels align with fair value, sentiment measures crowd positioning around levels, and economic data flags catalysts that could trigger level tests.
The result is a set of levels that reflect genuine multi-agent consensus, not the output of a single indicator or a retail trader drawing trendlines.
Our paid reports include specific support and resistance levels identified by six specialist agents — technical structure, institutional positioning, options flow, fundamentals, sentiment, and economic analysis. Not just lines on a chart, but zones validated by multi-discipline confluence.
Start Free — Get the Market of the WeekFree weekly report · No credit card · Upgrade anytime


