Russell 2000 Forecast This Week — Outlook, Drivers & Key Levels
This week's Russell 2000 outlook: key drivers, volatility context, risk-opportunity assessment and the week ahead.

Current Market Picture
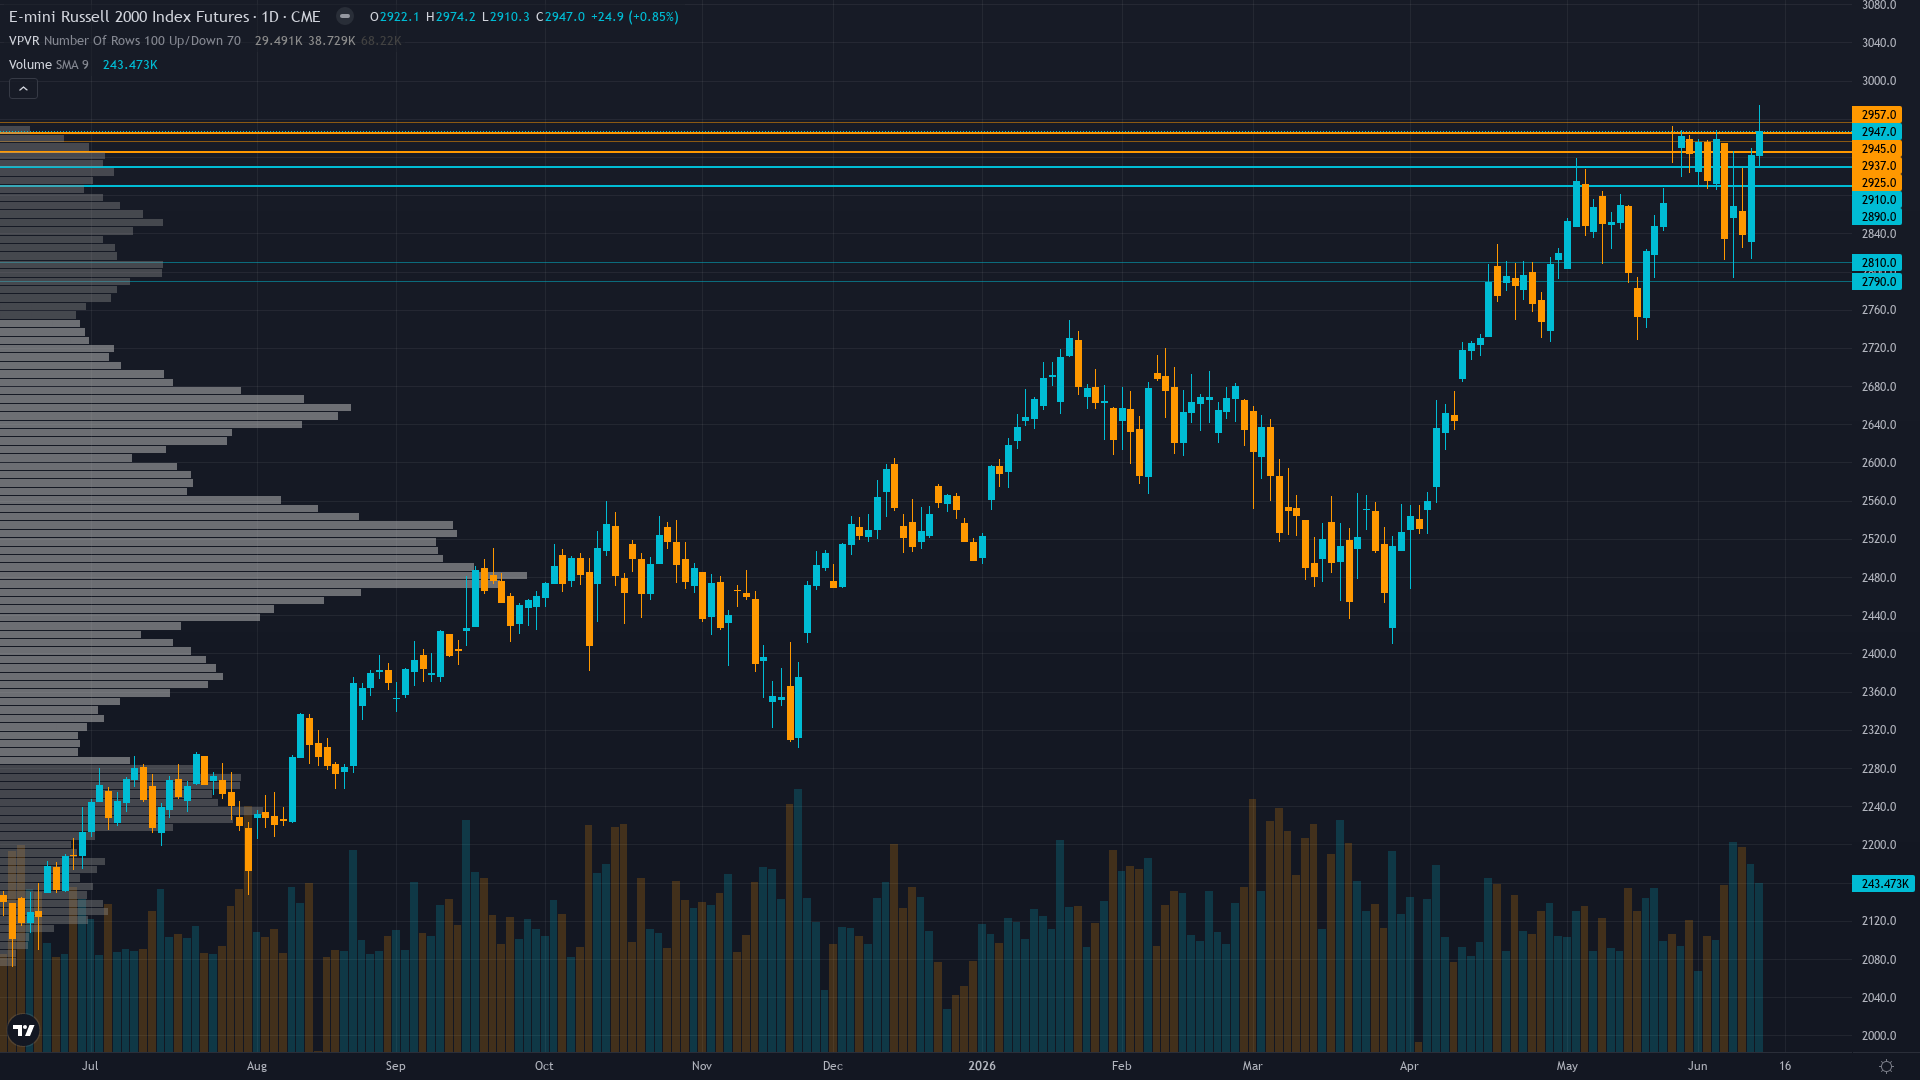
Russell 2000 holds at 2920.5, off 0.35% in a modest retracement from recent levels. The market in Russell 2000 futures is coiling, with narrowing price ranges suggesting stored energy that will eventually release.
Small-caps consolidating near May 27 all-time high with market positioned for June 26 Russell reconstitution to provide technical support, maintaining constructive outlook on Q2 earnings validation and value rotation narrative gaining institutional traction
Key Drivers This Week
Primary driver: Russell reconstitution June 26 (12 days away) creating estimated $200 billion in forced index rebalancing flows into small-caps, entering critical window where institutional positioning must execute ahead of effective date
Secondary factor: Sentiment contrarian setup with AAII bearish readings at 47.7% (near 1-year high) and Fear & Greed at 34 (Fear) creating tactical bullish opportunity as retail investors reach pessimistic extreme while price consolidates just 0.9% below May 27 ATH of 2,947
Additional influence: Post-input development: Seeking Alpha June 13 reports significant rotation into small and micro caps last week with investors shifting toward value over growth for second consecutive week, confirming small-cap leadership emerging despite bearish sentiment
Economic backdrop: RISK-ON macro regime with VIX 19.44 below 20, ISM PMI 54.0 expansionary, May jobs +172K beat, Fed on hold at 3.50-3.75% with June 17 FOMC meeting showing 99% no-change probability, strong retail sales and declining VIX confirming risk appetite supporting equities
Fundamental assessment: Q2 2026 earnings season active with 40%+ aggregate growth expectations, but forward P/E at 25.39x versus 13.61-17.38x historical range creates vulnerability if results disappoint elevated bar, reconstitution catalyst in 12 days provides fundamental validation opportunity
Volatility Backdrop
RTY futures volatility at the 45th percentile reflects a balanced environment where standard risk parameters apply. Volatility remains anchored at current levels, with no clear signal of an imminent regime shift in either direction.
Normal volatility regime at 45th percentile supports standard risk management with 2-3% stops below 2,860 support, expect 30-50 point daily ranges versus 60-100 during elevated volatility periods, stable pattern suggests consolidation environment until June 17 FOMC or June 26 reconstitution catalyst provides directional clarity with today's 17-point range confirming compression
Historical Seasonal Bias
Seasonal patterns flag a bearish tendency for small-cap futures in June 2026 (42% win rate). Summer doldrums typically hit small-caps harder.
Chart Assessment
Price at 2,920 consolidating 0.9% below May 27 all-time high of 2,947, holding constructive structure above 2,890 immediate support with RSI 34 oversold creating mean-reversion setup, uptrend intact above 50-day MA at 2,492 and 200-day at 2,564
With trend strength at 6/10, there's a clear directional tilt but room for the move to develop further.
Risk & Opportunity
Primary risk: Q2 earnings season delivering materially below 40%+ YoY growth consensus triggering multiple compression from elevated 25.39x forward P/E, particularly if June 17-18 FOMC delivers unexpected hawkish surprise removing small-cap easing narrative and pressuring credit-sensitive Russell 2000 constituents (Probability: medium)
Primary opportunity: Reconstitution-driven rally as forced index rebalancing flows into June 26 effective date create technical support, targeting breakout above 2,940-2,947 resistance toward 2,980-3,000 measured extension if sentiment extreme reverses and Q2 earnings validate 40% growth trajectory (Timeframe: 1-2 weeks through June 26 reconstitution effective date and early Q2 earnings validation)
This week's edge: Market consensus may be underpricing the magnitude of reconstitution-driven flows in 12-day window while overweighting sentiment bearishness (AAII 47.7% bears) as contrarian opportunity, desk sees tactical bullish setup with calendar catalyst providing high-probability support versus crowd pessimism creating entry point
Looking Forward
On the calendar, Federal Reserve FOMC Meeting June 17-18 with statement June 18 and forward guidance critical for rate-sensitive small-caps, though 99% market expectation of hold at 3.50-3.75% limits surprise potential unless dot plot or Powell commentary shifts on Wednesday 17 June carries moderate market-moving potential and warrants attention in trade planning.
The week ahead for RTY futures hinges on whether the prevailing consolidating regime can absorb the scheduled catalysts without a regime shift.
This analysis covers one dimension. Our full weekly report combines six specialist agents into a single actionable briefing with directional bias, key levels, and risk-opportunity matrix.
Start Free — Get the Market of the WeekFree weekly report · No credit card · Upgrade anytime


