Russell 2000 Forecast This Week — Outlook, Drivers & Key Levels
This week's Russell 2000 outlook: key drivers, volatility context, risk-opportunity assessment and the week ahead.

Current Market Picture
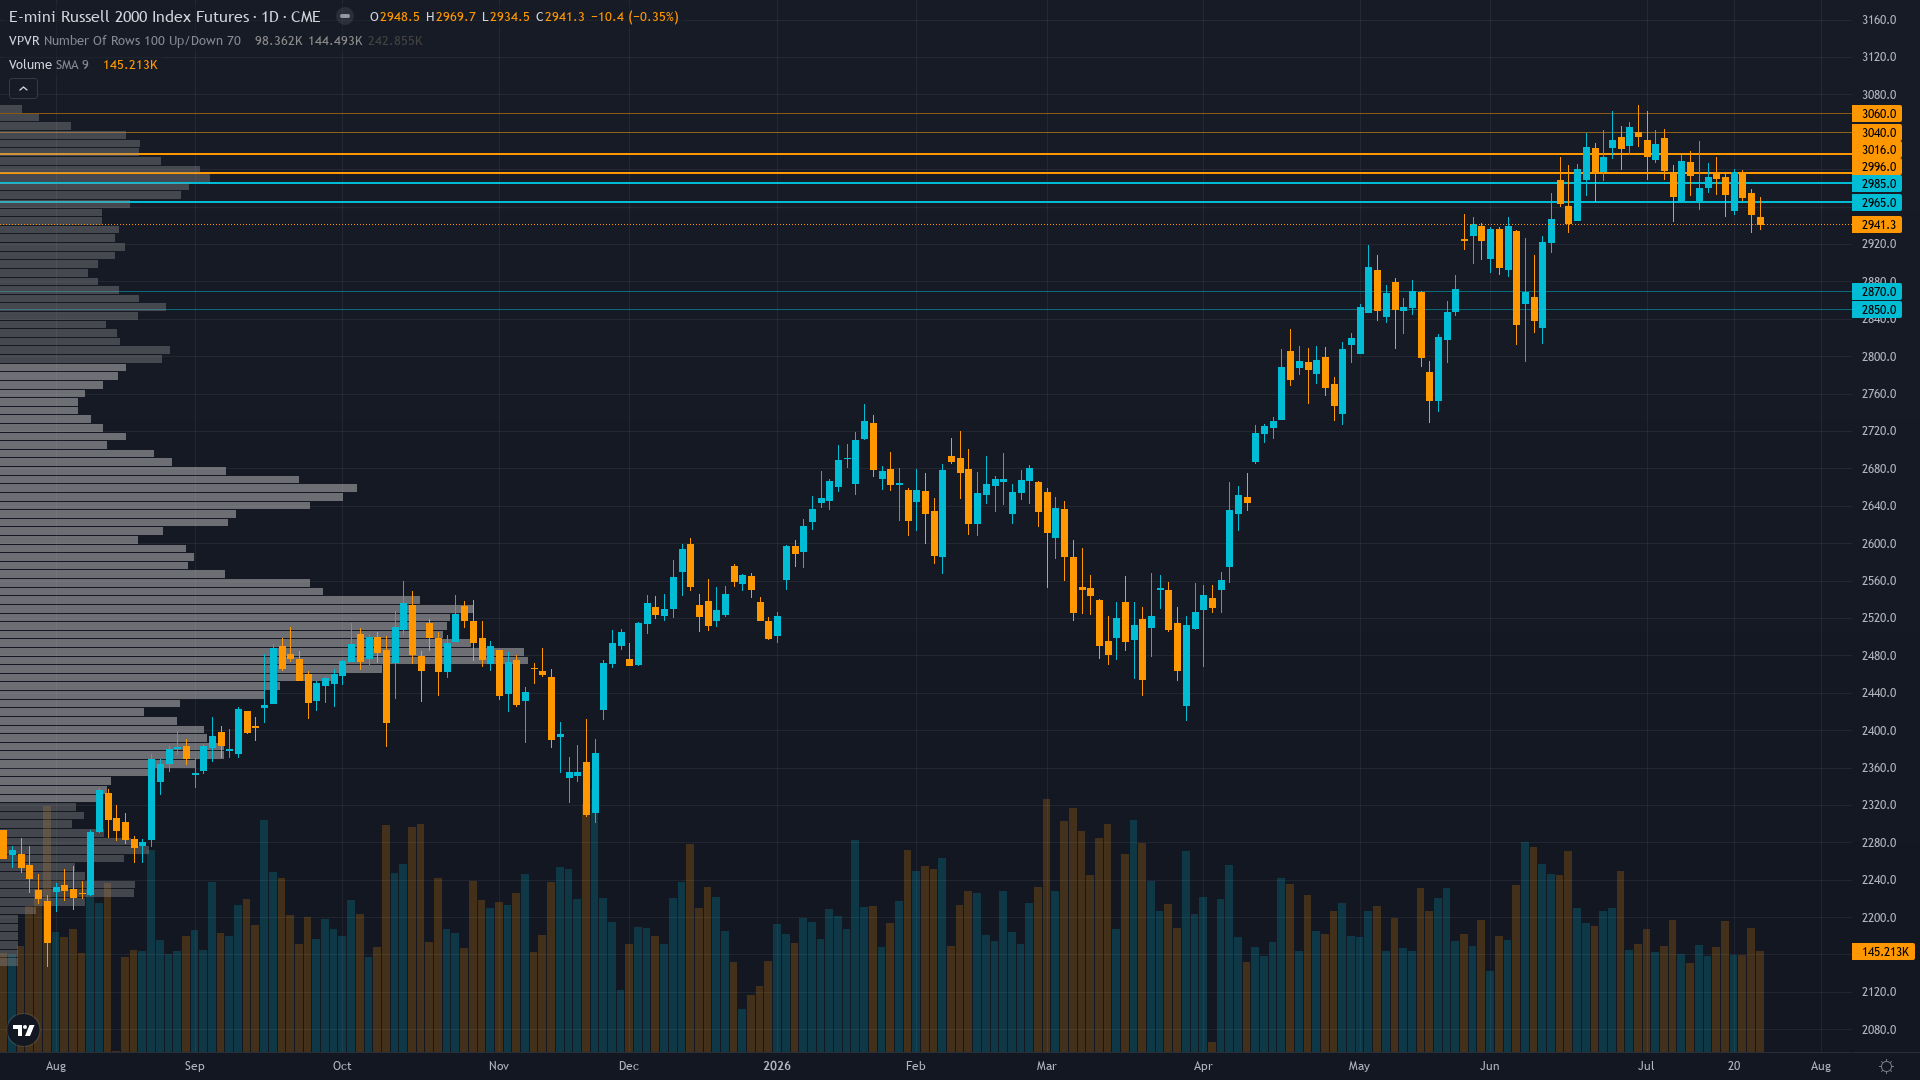
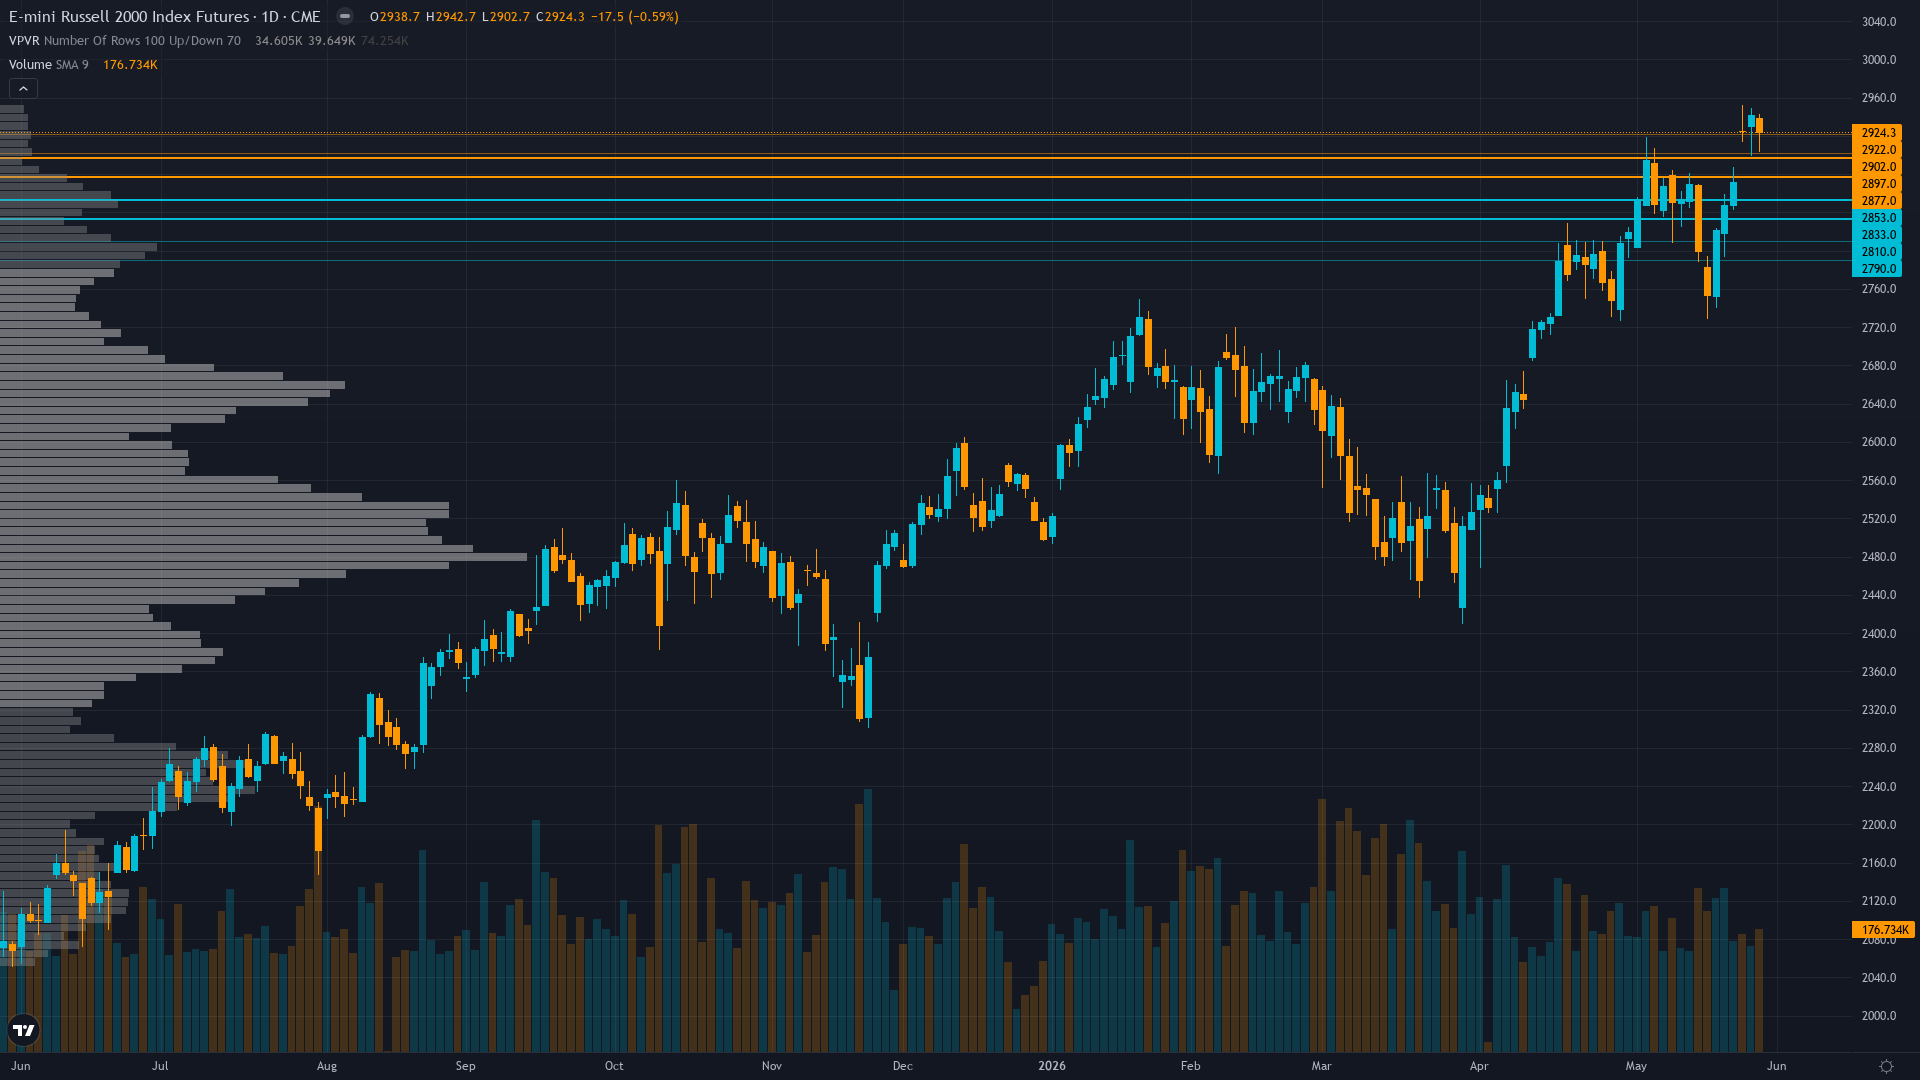
Russell 2000 holds at 2905.3, up a marginal 0.18% as the market grinds forward. The market in Russell 2000 futures is coiling, with narrowing price ranges suggesting stored energy that will eventually release.
Small-caps consolidating near May 6 all-time high at 2912.0 with market positioned for June 17-18 FOMC to provide rate path clarity, maintaining constructive outlook on Q1 earnings validation and benign volatility environment supporting equity grind higher
Key Drivers This Week
Primary driver: Post-input development identified: RTY trading at 2905.30 on May 31, 2026 consolidating just 0.2% below May 6 all-time high of 2912.0, creating constructive consolidation structure near record levels following four consecutive missed graded calls requiring heightened analytical discipline
Secondary factor: VIX normalization to 15.32-16.33 range confirms sustained RISK-ON macro regime creating benign volatility backdrop for equities, with equity put/call at extreme 0.39 showing dangerous complacency but no defensive positioning collapse yet
Additional influence: Extreme sentiment complacency (VIX 15.32, put/call 0.39 at multi-year lows, AAII recent readings showed greed) combining with four consecutive missed directional calls (May 29 NO CALL +1.83%, May 22 BEARISH +2.54%, May 15 BULLISH -3.43%, May 8 NO CALL +4.53%) mandating neutral stance for analytical recalibration
Economic backdrop: Fed on hold at 3.50-3.75% with June 17-18 FOMC meeting 18 days away showing 98% market expectation of hold per Polymarket, RISK-ON macro regime with VIX below 20 and credit spreads at 80bps near 25-year lows removing immediate downside catalysts
Fundamental assessment: Q1 2026 earnings delivered 44.9% YoY growth consensus per May 7 LSEG data providing fundamental validation, but elevated forward P/E at 25.39x versus 13.62-17.34x historical range creates valuation vulnerability to Q2 earnings delivery risk beginning mid-July
Price Structure
Consolidating 0.2% below May 6 ATH at 2912.0 with current price 2905.30, holding constructive structure above 2875 immediate support with intraday range 2899.70-2926.20 showing normal volatility compression near record highs
Trend strength sits at 6/10, reflecting a market that has directional bias but hasn't reached extreme conviction.
Upside & Downside
Primary risk: Sentiment complacency extremes (VIX 15.32, put/call 0.39 at multi-year lows, greed readings) combining with elevated valuation at 25.39x forward P/E and June 17-18 FOMC hawkish surprise triggering 5-8% correction toward 2750-2800 support as positioning unwinds from all-time high levels (Probability: medium)
Primary opportunity: Consolidation near May 6 ATH at 2912.0 holding 2875 support creating continuation structure targeting breakout above 2920 resistance toward 2950-3000 measured extension if June FOMC provides accommodative forward guidance and Q2 earnings validate 44.9% growth trajectory beginning mid-July (Timeframe: 2-4 weeks through June 17-18 FOMC meeting and early Q2 earnings releases)
This week's edge: Resetting after 4 consecutive missed graded calls — analytical framework under review regardless of current bullish discipline agreement
Volatility Context
At the 45th percentile, RTY futures volatility sits in a normal range, neither compressed enough to signal a breakout nor elevated enough to demand caution. Realised vol is holding its current level, suggesting the market has found a temporary equilibrium in its risk pricing.
Normal volatility regime at 45th percentile supports standard risk management with 2-3% stops below 2835 support, expect 30-50 point daily ranges versus 60-100 during March correction, stable pattern suggests consolidation environment until June FOMC catalyst with today's 2899.70-2926.20 range confirming compression
Seasonal Patterns
Seasonality is a non-factor for small-cap futures this month, with a 48% historical win rate offering no edge. Sell in May narrative can weigh on small-caps.
Looking Forward
All eyes turn to Federal Reserve FOMC Meeting June 17-18 with statement June 18 and forward guidance critical for rate-sensitive small-caps, following April NFP beat removing recession concerns but reinforcing higher-for-longer policy stance affecting credit conditions on Wednesday 17 June, which carries enough weight to force a decisive directional move.
The week ahead for RTY futures hinges on whether the prevailing consolidating regime can absorb the scheduled catalysts without a regime shift.
This analysis covers one dimension. Our full weekly report combines six specialist agents into a single actionable briefing with directional bias, key levels, and risk-opportunity matrix.
Start Free — Get the Market of the WeekFree weekly report · No credit card · Upgrade anytime