Russell 2000 Forecast This Week — Outlook, Drivers & Key Levels
This week's Russell 2000 outlook: key drivers, volatility context, risk-opportunity assessment and the week ahead.

Market Overview
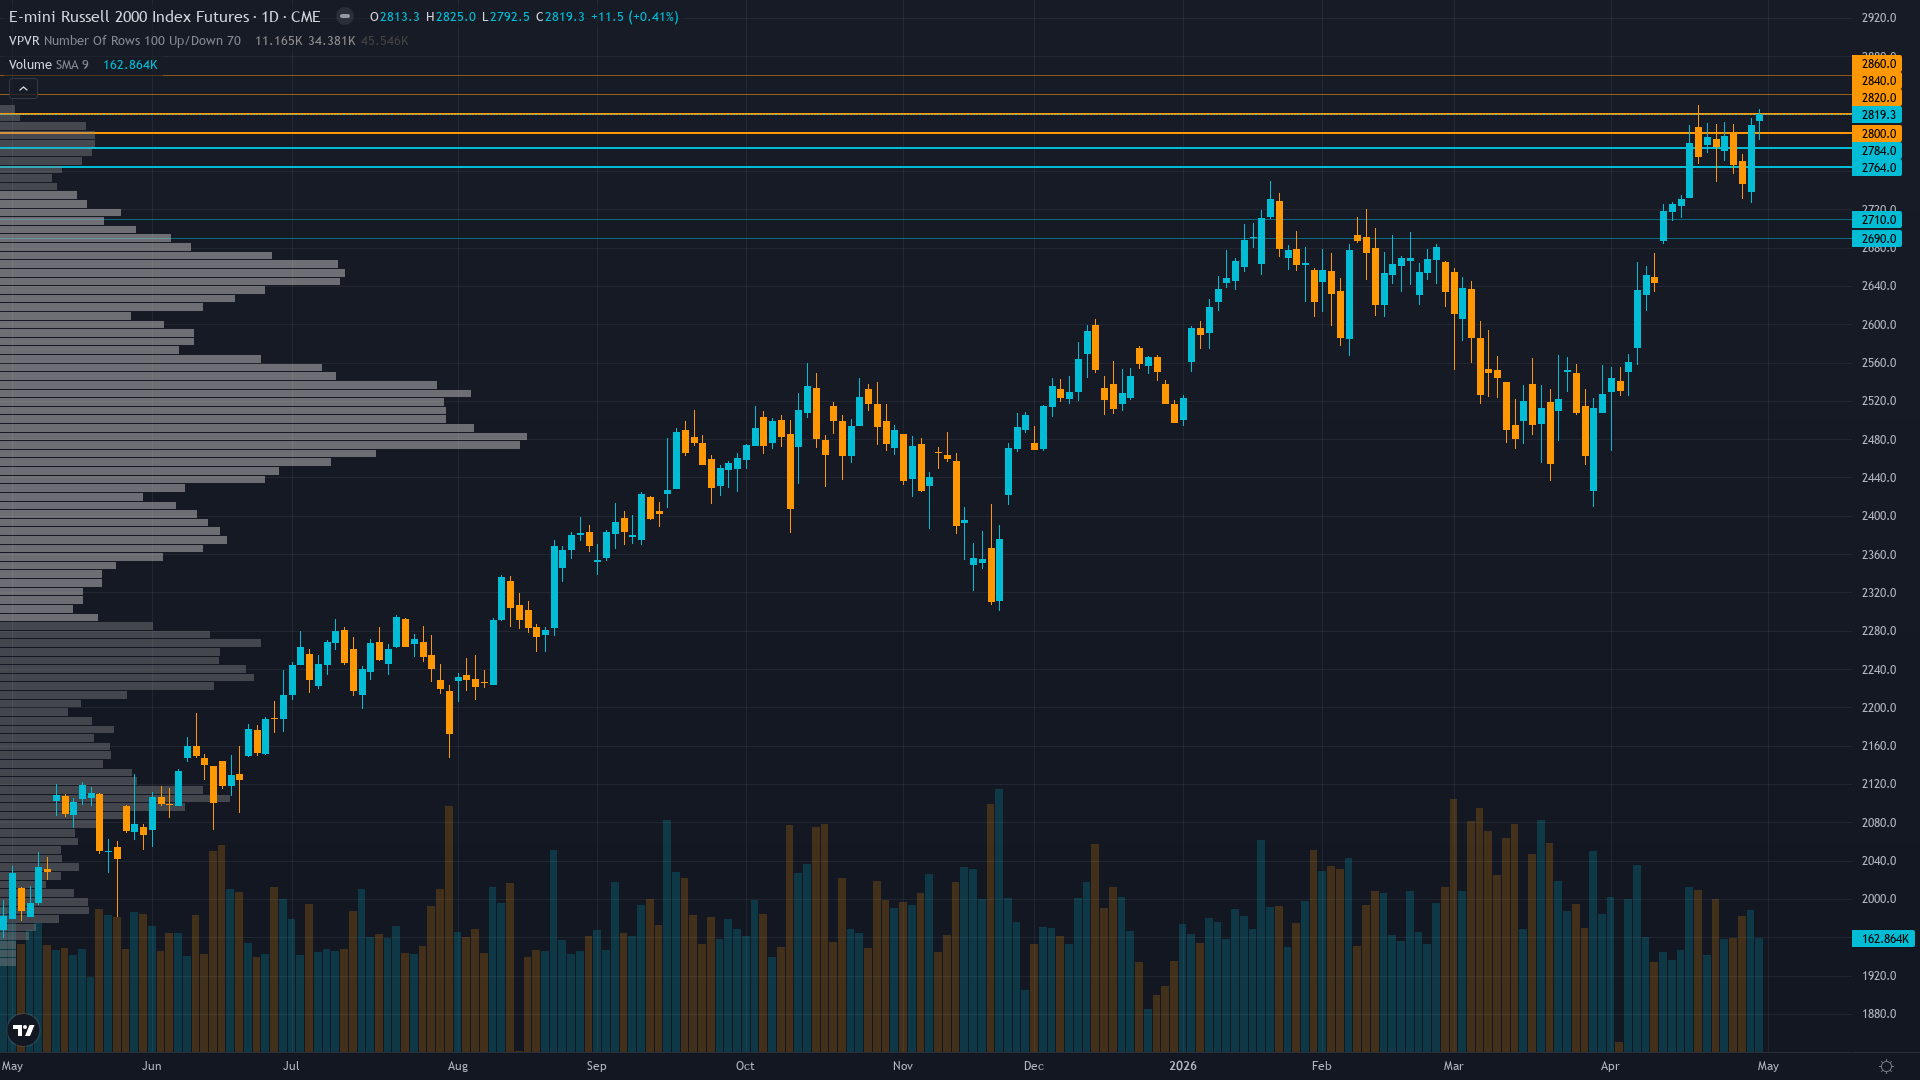
Russell 2000 is trading at 2743.3, up a modest 0.41% as the market edges higher. Russell 2000 futures is range-bound and tightening, with decreasing volatility signalling a directional resolution ahead.
Small-caps consolidating near recent highs with market positioned for FOMC May 6-7 to provide rate path clarity, maintaining constructive outlook on Q1 earnings validation and eventual Fed easing supporting rate-sensitive small-caps
This Week's Catalysts & Drivers
Primary driver: Last week's NO CALL at conviction 5 was CORRECT (+0.63% weekly gain), but severe discipline conflict persists with 4 of 6 agents showing bearish/neutral leans versus price action holding near recent highs at 2743
Secondary factor: Technical breakdown signal (-2, conf 6) showing price below 50/200-day MAs at 2492/2564 with RSI 33.7 oversold creates analytical contradiction with current price at 2743—likely data lag between cash index and futures pricing
Additional influence: VIX normalization to 16.78-16.89 from prior elevated March levels confirms sustained RISK-ON regime, but FOMC meeting May 6-7 (3 days away) creates binary event risk for rate-sensitive small-caps with no fresh catalyst until then
Economic backdrop: Fed on hold at 4.25-4.50% with May 6-7 FOMC meeting 3 days away showing 100% market expectation of hold, April NFP beat at 178K removes recession risk but reinforces no-cut narrative pressuring rate-sensitive small-caps
Fundamental assessment: Q1 2026 earnings season concluded with 44.9% YoY growth consensus providing fundamental validation opportunity, forward P/E at 25.39 elevated versus 13.62-17.34 historical range creating vulnerability
Technical Picture
Price at 2743 trading 1.6% below April 17 ATH of 2797 but Technical agent showing BEARISH signal with downtrend below MAs—severe data inconsistency suggesting futures vs cash divergence
At 6/10, trend strength indicates a solid directional lean without being overextended.
Bull & Bear Case
Primary risk: FOMC May 6-7 delivers unexpectedly hawkish forward guidance or raises dot plot terminal rate removing easing hopes, triggering 5-8% correction toward 2650 major support as credit-sensitive small-caps reprice (Probability: medium)
Primary opportunity: Continuation consolidation holding 2700-2800 range into FOMC provides clarity supporting extension toward 2850 resistance as Q1 earnings validate growth and Fed maintains accommodative stance without hawkish surprise (Timeframe: 1-2 weeks through FOMC meeting and post-decision price discovery)
This week's edge: Market consensus may be underpricing FOMC hawkish surprise risk given extreme complacency signals (VIX 16.78, put/call 0.41) while overweighting earnings optimism already validated, though desk neutral stance reflects appropriate caution ahead of binary catalyst rather than directional conviction
Volatility Regime
Volatility for RTY futures is at the 52th percentile over 90 days — a normal regime that allows for standard position sizing and conventional trade management. The vol trend is flat, with no meaningful shift across timeframes. Stable vol environments often lull traders before a regime change arrives.
Normal volatility regime at 52nd percentile supports standard risk management with 2-3% stops below 2650 support, expect 40-60 point daily ranges versus 60-100 during March correction, stable pattern suggests range-bound environment until FOMC catalyst
What History Shows
small-cap futures enters May 2026 without a meaningful seasonal lean (48% win rate). Sell in May narrative can weigh on small-caps.
The Week Ahead
Federal Reserve FOMC Meeting May 6-7 with rate decision 2pm ET May 7 and Powell press conference 2:30pm ET, critical for forward guidance on rate path affecting small-cap credit conditions on Wednesday 6 May is a high-impact catalyst with the potential to redefine the near-term outlook entirely.
How Russell 2000 futures navigates the confluence of consolidating conditions and incoming data will determine whether the current directional thesis holds or breaks.
This analysis covers one dimension. Our full weekly report combines six specialist agents into a single actionable briefing with directional bias, key levels, and risk-opportunity matrix.
Start Free — Get the Market of the WeekFree weekly report · No credit card · Upgrade anytime


